.png)
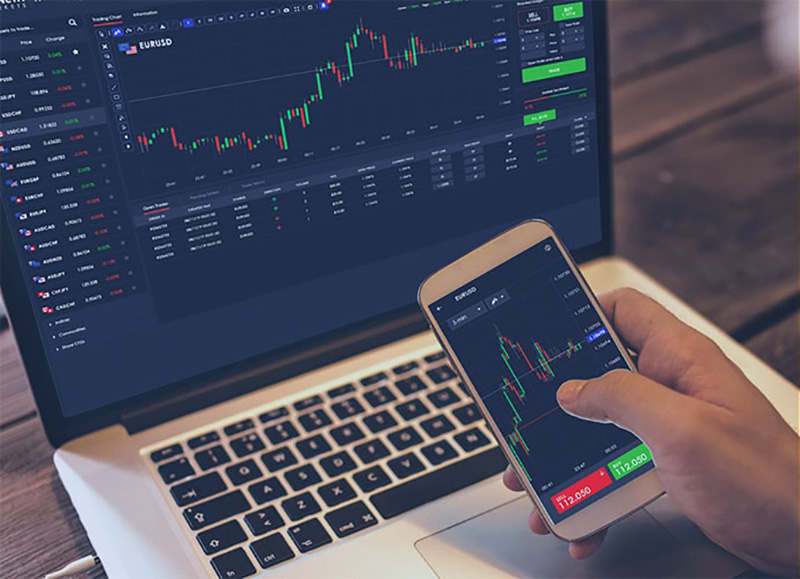
The modern era of trading and investment has ushered in India due to emerging and evolving digital trading networks and platforms. As per industry analysis, the market size of digital trading platforms is expected to surpass 15.34 billion USD by 2020. The widely spread internet accessibility and availability with quick technological advancement have made digital trading platforms popular among traders and investors.
People are offered accessible and convenient avenues through these networks, which assist them in participating in many financial markets, including the forex market, commodities market, stock market, etc., through mobile and web applications. However, it is crucial to understand the benefits and risks involved when dealing with digital trading platforms.
The participation of traders and investors in financial markets has revolutionized due to rising digital trading platforms. The platforms offer information availability and enhanced transparency to give investors access to the firm’s information, research reports, and real-time data on the market. Investors can make a wise choice in deciding their investment strategies.
It also assists them in levelling the playing field among institutional and retail investors and gives them the resources and tools for their effective competitive approach in the industry. The benefits offered by such networks include individual investors’ empowerment, diversified investment options, lower costs, accessibility, etc. Besides, certain risks of dealing with the networks must be addressed to trade effectively through digital trading platforms.
Financial markets are increasingly available through digital trading platforms since access is democratized. All geographical barriers are removed to let investors perform trading activities from every region. The easy availability of traditional trading networks’ locations near major financial market centres' limitations is eliminated. Anyone with internet access from any region or location can invest and trade.
Unparalleled flexibility and convenience are provided to investors and traders through digital trading platforms. Market movements can be monitored, and trading accounts can be accessed 24/7 to let investors trade or invest whenever and wherever they want. Besides, investors have easy accessibility to these platforms through mobile applications, laptops, or desktop computers. It helps them trade or invest even when they are travelling.
Investment and trading cost is significantly reduced on digital trading platforms. Traditionally, retail investors faced challenges in participating in the trading industry due to brokerage firms' high commissions and fees. However, digital trading platforms offer low trading costs and fees, making trading execution much easier for investors and traders. Many platforms even offer 0% trading commission to make trading and investing affordable for investors.
Digital trading platforms provide a wide range of asset classes and investment opportunities accessibility. It assists investors in trading derivatives, international markets, cryptocurrencies, commodities, bonds, and stocks. Such diverse investment opportunities let investors explore several avenues and maintain versatile portfolios for prospective returns.
Investment or trade in the financial market through digital trading platforms also has certain risks, as with other approaches. Investment performance can be impacted due to economic uncertainties, and asset costs fluctuations and market volatility. Investors must know about the potential losses and risks involved.
Investment and trading participation are made easier through digital trading platforms. But, it becomes challenging for inexperienced investors to understand and learn about the trading industry. It makes them suffer financial losses since they are more likely to make the right investment choices since their knowledge of risk management, market dynamics, and investment strategies is insufficient.
Internet connectivity and technology is the most crucial requirement for digital trading platforms. Even though these platforms are additionally efficient due to technological advancements, they inherit certain risks. Outages, system failures, or technical glitches don’t let investors trade at the required prices and disturb their trading and investment activities.
Digital trading platforms operate within regulatory settings, and their compliance is crucial. It ensures market integrity and investor protection. Investors and trading operators find it challenging to navigate complex requirements imposed by regulatory frameworks and remain updated with changing regulations and rules. The accessibility and functioning of digital trading platforms can be impacted due to regulation changes or non-compliance with regulatory frameworks.
As per the online trading platform market size of digital trading platforms, the industry is anticipated at a CAGR OF 6.4 per cent. Trading and investment have been significantly transformed due to evolving digital trading platforms. These platforms have provided new opportunities for investors and traders in India through easily accessible and convenient systems.
Investors can navigate the trading industry from anywhere and benefit from their investments and trades through awareness and the right approach.
However, investors and traders must learn the risks of digital trading platforms and take the necessary steps to overcome them successfully. Due diligence and performing in-depth analysis and research will help them mitigate inherent risks.
Connect with the stock market experts at NIWS - one of the best Stock Market Institute In Jaipur Delhi, and Indore offering the best Stock Market Courses In India, to learn about trading strategies and other details for profitable trades and a lucrative trading journey.

On May 17 2004, the stock market was in an uproar. When India's GDP growth was rolling at 8%, micro-and-macro economic factors were substantial; corporate balance sheets were robust with encouraging prospects for the following quarters; NSE Nifty and BSE Sensex fell by around 17% because of election results.
There was a possibility that UPA would form the government with Communist party support. However, the economy's fundamentals were stable. Still, negative sentiments resulted in the losses of trillions of rupees in just two sessions on the same day, and this sensitivity shock took months to recover.
One of the members of NITI Aayog- the government's think tank, made a public statement regarding the change in policies in the automobile sector. However, government policy was still under formulation, and this was just an assumption, resulting in the wiping out of 5% market capital of auto manufacturers.
Since this change was over and above the impact of motor vehicles' domestic demand contraction, Nitin Gadkari (Road and Transport Highway Minister) and Nirmala Sitharaman (Finance and Corporate Affairs Minister) had to state to control the damage urgently.
The pandemic began its widespread rampage in the early 2020s, and the government took precautionary measures like social distancing and lockdown. These mere measures prompted the S&P index to witness a 35% drop in March 2020.
This drop was significant compared to the 2008 financial crisis caused by financial deregulation.
Stock market fluctuating prices make equity investments risky, and risk-averse investors are advised to stay away from the share market. One cannot produce the future performance of the Indian stock market due to dynamic factors and policies.
Some factors that affect Indian Stock Market are -
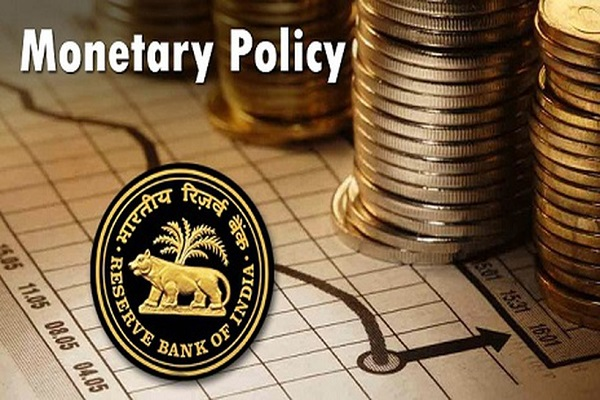
The Reserve Bank of India regulates the monetary policy in India and keeps reviewing it. Any changes in the Reverse Repo Rates or Repo Rates impact the stock prices. If RBI raises these rates, banks' liquidity reduces, making borrowing costlier and increasing the lending rates. With the costly borrowing rates, business communities find it difficult to service their debt obligations and start selling company shares, reducing stock prices.
Vice Versa happens when RBI follows a dovish monetary policy. Reduced lending rates increase credit expansion, considered a positive step, and the stock market begins to recover.
The Securities Exchange Board of India (SEBI) constantly monitors trading and investment policies. It keeps changing them, impacting the overall performance of NSE and BSE-listed shares.
When interest rates rises, the bank increases the lending rates, which increases costs for individuals and corporations, impacting the profit levels and affecting the shares of a company.
Inflation is when there is a sudden positive movement in the pricing of services and goods over a period of time. High inflation discourages long-term economic growth and investment. During high inflation, Indian Stock Market postpone their investment, which leads to -
Negative economic growth,
Fall in savings value,
Affects the stocks of luxurious companies.
Therefore, this not only impacts the purchasing power but also affects the investing power of companies and individuals.
Factors including budget, elections, stability, government intervention, and others may also significantly impact financial markets and the economy. Budget or political event announcements may create volatility levels in the market, affecting Indian Stock Market deeply.
How?
The sentiments of ordinary citizens may differ from investors' sentiments. People draw some expectations from the following political party and cite accordingly. Thereby, final result announcements may elicit a response from investors.
Short-term investors, like day traders, speculate on the coming or scheduled political events and invest within a week or a month. Long-term investors, on the other hand, do not influence their investment decisions based on daily events, take note of the policy decisions by the new government, and accordingly review their portfolios.
During the 2004 general elections, NDA Government, led by Atal Bihari Vajpayee, lost to the UPA, contrary to expectations. Election results were announced on May 13 2004. Sensex report for the next few days was -
Closed at 5,399 points on May 13 2004.
Fell 6% on May 14, 2004, and closed at 5,069.
On May 17 2004, recorded the third-worst fall, 565 points, and closed at 4,505.
All these figures reflect a thumbs down to the UPA government on December 27, 2004. Dr Manmohan Singh was elected the Prime Minister, and Sensex touched back 6,513.
Narendra Modi was expected to win, and the market was positively geared up for a second term. Sensex opened at around 39,815 points, and the market shot up by 1000 points, touching 40,000 for the first time in history, pointing to Narendra Modi-led NDA Victory.
However, apart from the strong positive sentiment amongst the investors, the profit booking drove down Indian Stock Market by 1300 points. Moreover, events including the Abrogation of Article 370, URI Surgical Strike and Demonetisation have also closely impacted the markets that follow policy and political announcements.
The Indian Stock market Institute In Jaipur is highly volatile, and it is no surprise that political factors can significantly impact its performance. Changes in government policy, such as tax reforms, changes in interest rates, or new regulations, can all substantially affect the stock market.
If you are an investor, it is essential to be aware of the potential impact of politics on the stock market. You can make more informed investment decisions by understanding the political landscape and the potential impact of policy changes.
To learn more about how politics and policies impact the Indian Stock Market, connect with experts in Jaipur and Delhi at NIWS (National Institute of Wall Street) - one of the best Technical Analysis course In Jaipur and Delhi, offering the best stock market course in delhi. NIWS is a leading provider of financial education and training, and they offer a variety of courses on the stock market and investment.
With NIWS's help, you can learn how to identify political risks and how to mitigate those risks in your investment portfolio. You can also learn to make informed investment decisions based on risk tolerance and goals.
To learn more about NIWS and the best Stock Market Courses in Jaipur and Jaipur, connect with the experts at 9261623456, or drop a mail with all your queries at info@niws.in to explore.
.png)
If you plan to invest your funds and generate profits in the long term, investing in the Indian Stock Market is a lucrative option. Replacing traditional investment options like regular deposits, fixed deposits, and others, investing in stocks is an excellent way to beat inflation. Moreover, the stock investment provides various other benefits, including -
There are two types of investments in the share market: short-term investments, which are held for 12 months or fewer, and long-term investments, which require holding an investment for more than 12 months.
Long-term investment includes holding assets like stocks, bonds, mutual funds, and ETFs (Exchange-traded Funds). Moreover, long-term wealth creation also requires patience and discipline, as investors must wait for higher rewards while undertaking the risks.
However, to proceed with profitable investments for long-term wealth creation in the stock market, traders and investors need to know the basics and, sometimes, advanced concepts of stock market trading.
If you plan to invest in the Indian stock market for long-term wealth creation, NIWS trading experts will help you with all the desired knowledge, tips and tricks. NIWS (National Institute of Wall Street) is one of the best stock market institutes in Jaipur and Delhi and provides a wide list of courses in BSE (Bombay Stock Exchange), NSE (National Stock Exchange), NCFM, SEBI and NISM Modules. All these courses help with banking, stock market, finance, wealth and portfolio management.
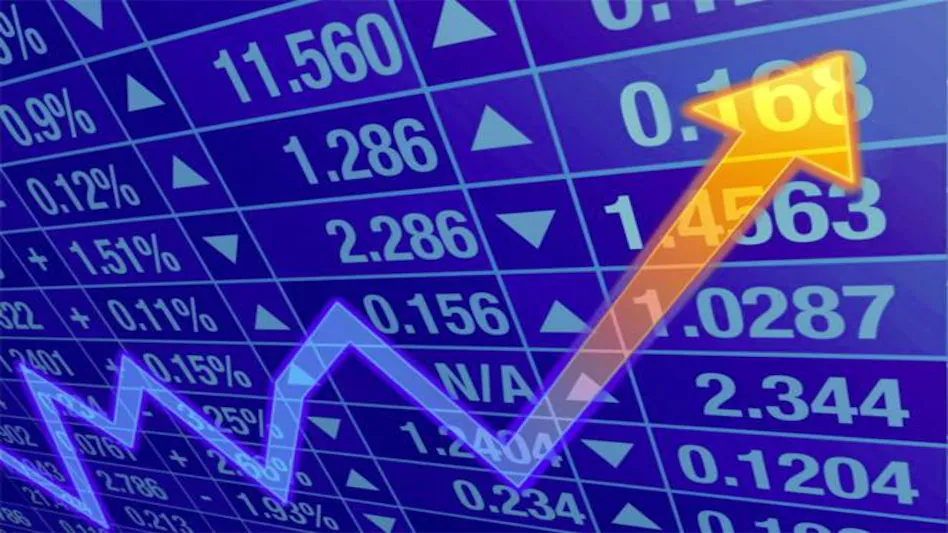
The Indian stock market is one of the largest and most vibrant in the world. It is a great place to invest for both beginners and experienced investors. Here is an overview of investing in the Indian stock market:
The stock market can be a great way to create wealth over the long term. Here are some of the benefits of investing in the stock market for long-term wealth creation:
The stock market can potentially deliver high returns over the long term. This is because the stock market measures the value of all the companies listed on the stock exchange. As these companies grow and become more profitable, the value of their stocks should also increase.
Investing in the stock market can help you diversify your portfolio and reduce risk. This is because you are not putting all your eggs in one basket. Instead, you are spreading your money across different companies and sectors. This helps to protect your investment if one company or sector performs poorly.
The stock market is very liquid, so you can easily buy and sell stocks. This is important because it allows you to access your money quickly if you need it.
Many tax benefits are available to investors who invest in the stock market. For example, you may claim capital gains tax relief on your investments.
The stock market is complex and volatile, and it is essential to know how it works before investing in the long term. Here are some of the reasons why it is necessary to get stock market knowledge before funding for a long time:
The stock market is constantly changing, and it is essential to understand its driving factors. This will help you make informed investment decisions and avoid costly mistakes.
The stock market can be risky, but there are ways to reduce your risk. By understanding how the market works, you can better decide which stocks to invest in and how much to invest.
The stock market can be volatile, and the prices of stocks can go up and down sharply. Understanding the risks involved can protect your investment and avoid losing money.
If you are investing for the long term, it is essential to understand your investment goals clearly. By understanding how the stock market works, you can make better decisions about investing your money and achieving your goals.
The more knowledge you have about the stock market, the better equipped you will be to make informed investment decisions and achieve your financial goals. So if you are thinking about investing in the long term, it is essential to know the basics of the Indian Stock Market.
For all the investors or traders planning to invest their funds in Indian Stock Market for long-term wealth creation, expert traders and professional stock market trading courses in delhi by NIWS will help you.
The Stock Market Institute In India has 15+ years of experience with international and domestic stock market professionals who help students achieve their career goals and aspirations in trading while helping with 100% job placement.
Connect with the stock market professionals at NIWS to learn more about Indian Stock Market investing for long-term wealth creation.

Gautam Adani, the chairman and founder of the agitated Adani Group, reclaimed his spot among the top 20 richest individuals on the Bloomberg Billionaires list. The billionaire's net worth raised by $4.38 billion to $64.2 billion on 23 May as the share prices of the companies in the Adani group rose in the stock market. This move propelled Gautam Adani to 18th among the world's richest people, bypassing figures like Jacqueline Badger Mars and Zhong Shanshan.
After Hindenburg Research's research on the Adani group, Gautam Adani's net worth notably decreased, and he fell off the top 20 list on 3 February 2023. Adani, who was previously the second-richest person in the world and had an estimated worth of $154 billion in September 2022, is down by $56.4 billion since the year started.
Hindenburg Research released a report on the Adani Group on 24 January. It claimed that utilising derivatives traded outside of India and US-listed bonds, Gautam Adani and his brothers had participated in stock manipulation, had influence over a large number of offshore shell companies, and had taken a short position in the Adani Group companies.
However, if you need to do the analysis of the comapanies stock for investment you need to have the right knowledge about the Stock Market, for this you can grab the knowledge about it by getting enrolled in Stock Market Course In Indore.
The research also stated that due to excessive valuations, its seven most influential listed companies had an 85% downside just on a fundamental basis. The corporation has, however, refuted every charge.
The apex court published the panel's findings, which, in contrast to what Hindenburg claimed in January, did not identify any regulatory shortcomings with reference to the price orchestration in Adani Group stocks.
Although the market regulator, the SEBI, has been given two more months to investigate the matter, the study's first findings were a massive reassurance for Dalal Street investors, and this was indicated in the share prices.
for more Stock Market knowledge join stock market Institute in India
Most of the Adani Group stocks have recovered most of their losses and appear to come back to their pre-Hindenburg report levels.

Suppose you have XYZ asset in your portfolio, purchased at INR 200, currently valued at INR 180, and, based on the declared quarter results, the stock value is expected suddenly fall more. But according to your research, the company is planning for a change and is about to launch the same, which holds a high chance of a price increase, possibly a 2x or 3x surge in the current price. So, you wish not to sell the stock at a lower price but also to protect the risk (if your prediction goes wrong!)
So, in this jumbled-up situation, Option Trading strategies are your saviour. But before we begin with the option trading details, here’s a quick overview of hedging (a financial strategy that protects against risk).
Hedging is a financial strategy that helps offset risk, protecting yourself against loss and paying a premium for the same.
To begin with, here’s an easy example to explain what hedging is and how it helps wave off the risk!
Rice Farmer and Rice Futures Market -
A farmer plants his winter rice seeds in June-July and plans to sell his harvest in November-December. However, in the six months gap, the farmer is subject to the price risk that it might fall from its current value, INR 80/Kg. While the farmer is planning for maximum profits on his harvest, he also does not want to speculate on the price of rice. So, after planting the seeds, he sells a 6-months (expiration date) futures contract for INR 80/Kg (the strike price).
Six months have passed, and the farmer is now ready to sell his harvest. So, there might be three situations, either the price is the same, has fallen or has increased.
In case of the same price, i.e., INR 80/Kg, the farmer will sell at no profit or loss.
In case of a price fall to INR 70/Kg, the farmer will be on the safe side, selling his harvest at the pre-decided price, INR 80/Kg, preventing the loss of INR 10/Kg.
In case of a price rise, INR 90/Kg, the farmer will sell his lot at the pre-decided future contract price, INR 80, recording a loss of INR 10/Kg.
This is termed hedging, where the rice farmer has limited profits and losses.
Options are trading contracts that give the holder the right to sell or purchase a share when it reaches the strike price or before the contract expiration date. However, options trading only gives the right, not the obligation, to sell or purchase.
Call Options - If you believe that the stock’s market price has a chance to rise from its current level, you will buy a call option.
Put Options - If you believe that the market price of the share will fall below the current price, you will buy a put option.
The risk factor is, therefore, limited when buying put or call options and more when selling the same.
However, to get the more depth knowledge you need to have the experts guidence to trade in the Stock Market, you can join stock market classes indore to make more profitabel trades.
To explain it in easier terms, let’s relate options trading with hedging with an example -
You own 50 stocks of XYZ Company, and bought these stocks at INR 10 each. You are concerned that the price of this stock might fall in future and want to limit your risk. In this case, you will buy a call option at a strike price of INR 8 (which will give you the right and not an obligation) after paying INR 50 premium, with an expiration period of 1 month. Suppose the price fell to INR 5 (recording a loss of INR 250) after 15 days, but since you had a put option at INR 8, you are at INR 150 profit from the current price, recording a total loss of INR 100 only.
Suppose the price rises to INR 20; your profit will be INR 10 x 50 stocks = INR 500 - INR 50 (premium paid), which is INR 450 (total profits).
Options trading with hedging can effectively minimise the risk of potential losses caused by price fluctuations, safeguarding investments.
Options contracts are highly flexible regarding strike prices, expiration dates, and other factors, allowing investors to customise their hedging strategies to their specific needs and goals.
Despite being a risk-averse strategy, options trading with hedging still offers gains if the underlying asset's price moves in the investor's favour, enabling investors to benefit from favourable market conditions.
By hedging with options contracts, investors can limit their losses to a predetermined amount, providing greater certainty and peace of mind in uncertain market conditions.
Compared to other hedging strategies, options trading can be relatively cost-effective, particularly when combined with other methods, making it accessible to many investors.
The options market is highly liquid, which means that options contracts can be easily bought and sold, giving investors greater control over their hedging strategies and facilitating the quick execution of trades.
Financial terms for trading and investment, including hedging, options trading, and options trading with hedging, are quite challenging to understand without clearing out the basics. And trading with fewer or no details about the financial terms can lead to significant losses.
If you want to hedge in options trading, NIWS courses in Jaipur and Delhi or online trading courses will help you. NIWS is a renowned Stock Market Course in India. It offers the best modules for finance, banking, fundamental analysis, technical analysis, wealth management, stock market, portfolio management and other high-paying skills.
For all trading and stock market enthusiasts, book your free demo with the experts to excel in your skills.
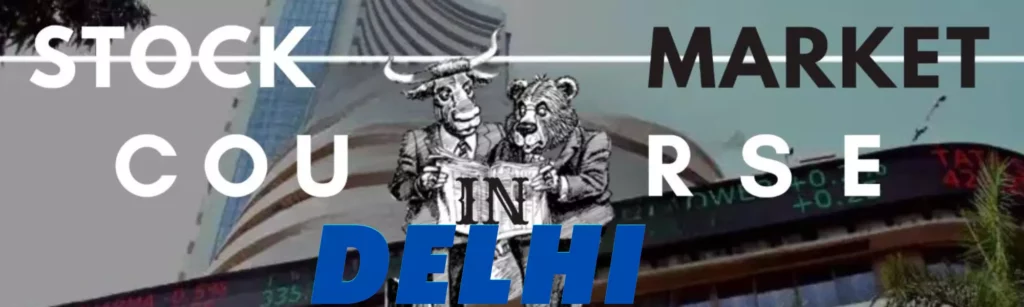
The world of stock markets is tough for those new to the field. With different terms, strategies, and theories, you might need help knowing where to begin. That's where the online Stock Market Course In Delhi comes in. So, now you can learn the best of the stock market through online courses NIWS Delhi provides.
NIWS is a well-known institution offering a wide range of courses in finance and investing. The team is highly experienced and qualified, with excellent knowledge and expertise in the stock market. Their online Stock Market Institute In Jaipur and stock market course in Delhi are accessible and flexible, allowing students to learn at their required speed and in their own time.
With NIWS Delhi, you can expect to learn about various topics. It includes technical analysis, fundamental analysis, derivatives trading, and more. They are also highly interactive, with plenty of opportunities for students to ask questions, participate in discussions, and receive feedback on their work. It ensures that students are fully engaged and can maximise their learning experience. These are the two online courses offered by NIWS Delhi.
Learn the secrets of successful traders with our Technical Analysis course. Discover unique trading ideas for Intraday, Swing trade, Short term delivery, Futures & Options. The topics use logical and easy mathematical formulas that many traders, brokers, and fund managers use. You can easily understand the risk of trading and identify profit targets with Technical Analysis.
Requirements: Candidate must have minimum HSC (10+2) qualification. A graduation degree is necessary to get NCFM certification and become an analyst.
What You Can Learn In This Course:
The Advanced Option course will prepare individuals for the NCFM Modules Certification in options strategy courses, focusing on the valuation of derivatives. The course covers topics such as forwards and futures, call and put options, option pricing, and the Black-Scholes Formula, as well as strategies for trading and hedging. By taking this course, individuals can understand derivatives valuation and better prepare for the certification exam. This certification can be valuable for those seeking finance, trading, or risk management careers.
Requirements: 10+2 education for self-trading, graduates preferred for good organisation placements.
Learning Advanced Technical Analysis and Advance Option Courses can benefit individuals who want to excel in trading and investing. Here are some of the reasons why you should consider taking these courses:
By taking these courses, you can deeply understand technical analysis and options trading. This knowledge can help you make informed decisions and take calculated risks while trading or investing.
Learning about technical analysis and options trading can expand your skill set and enable you to explore new opportunities in the financial markets.
Learning about different technical analysis tools, chart patterns, and options trading strategies can improve your trading performance and achieve better investment returns.
These courses help you prepare for the NCFM Modules Certification in options strategy courses, which can increase your chances of getting good organisation placements. Moreover, the knowledge and skills you acquire from these courses can add value to your finance, trading, or risk management careers.
By learning about risk management and trading rules and tools, you can identify profit targets and minimise losses while trading or investing.
By learning to read and interpret different charts, indicators, and options payoffs, you can gain insights into market trends and make more informed decisions.
In conclusion, NIWS Delhi offers excellent online Stock Market Course In Delhi for people all over India who want to start a career in the stock market or improve their existing skills. They have experienced teachers, practical training, and a full curriculum, making them a top choice for many who want to trade or invest in stocks.
The courses cover topics for both beginners and advanced learners.
The teaching methods involve practical experiences such as case studies, live trading sessions, simulations, and quizzes.
NIWS Delhi provides job placement assistance and career guidance.
Online courses allow students to access course material and attend classes conveniently.
The courses are cost-effective and provide value for money.
NIWS is an excellent option for anyone interested in starting a career in the stock market or improving their existing skills through the best options for the Stock Market Institute In Delhi.
Contact NIWS and buy the perfect stock market course in Indore or Delhi today.


Start with a demonstration class.