
Want to learn how to trade stocks and make smart financial decisions? NIWS (National Institute of Wall Street) is the go-to place for stock market education in Ridhi Sidhi, just 1 minute away. Whether you're new to the stock market or looking to sharpen your skills, they offer courses that are easy to understand and led by experts.
At NIWS, you’ll get practical, hands-on training to help you confidently start trading. Ready to take charge of your financial future? Join NIWS and turn your interest in the stock market into accurate results!
NIWS is a leading stock market institute in Jaipur that specialises in financial market education. Offering a wide range of courses, including NSE, BSE, SEBI, and NISM certifications, NIWS has been empowering students for over 15 years. With a strong focus on practical learning, expert faculty, and guaranteed job placements, NIWS equips learners with the tools they need to succeed in stock trading, portfolio management, and more.
Global Program in Financial Market Management (GPFMM): Comprehensive training covering global markets, trading, and financial regulations.
6-Month Program in Financial Market Management (PFMM): Focuses on market analysis, investment strategies, and portfolio management.
NIWS Certified Diploma in Research Analyst: Prepares students for a career in financial research and analysis.
Investment Analysis and Portfolio Management: Training on investment evaluation and managing portfolios.
Certificate in Stock & Financial Markets: Covers essential knowledge for beginners in stock markets.
NIWS Certified Smart Investment and Trading Professional: Teaches smart investing and trading strategies.
NIWS Certified Fundamental Analysis: Focuses on analyzing company fundamentals for investment decisions.
NCFM Certification Preparation Module: Prepares students for NCFM (NSE's Certification in Financial Markets) exams.
Fundamental Analysis Crash Course: A short course to quickly understand the basics of fundamental analysis.
NIWS Certified Technical Analyst: Teaches techniques for predicting market trends using charts and indicators.
NIWS Certified Options Strategy Professional: Advanced strategies for options trading.
NIWS Certified Smart Investment and Trading Professional: A detailed course for developing investment and trading strategies.
Technical Analysis Crash Course: This short course covers basic and advanced technical analysis techniques.
Professional Elliott Wave: Advanced theory of market patterns used for stock forecasting.
W.D. Gann: A specialized course based on Gann's time and price forecasting techniques.
Harmonic Trading Course: Teaches harmonic patterns to identify market reversal points.
Neo Wave: An advanced version of Elliott Wave theory for precise market forecasting.
Courses range from basics to advanced stock market strategies.
Practical training with real-time market simulations.
Strong job placement assistance for career growth.
Strong emphasis on practical training with live market scenarios.
Offers both online and classroom training options.
Provides placement support and career-building opportunities.
Via Mansarovar Link Rd/Shri Hans Marg: (210 m in 1 minute)
Head southwest on Mansarovar Link Rd, pass SLICE on the right, then turn left at Paneer Chole Kulche Wala. Your destination is on the left, after 29 metres.
Via Mansarovar Link Rd/Shri Hans Marg: (230 m in 3 minutes)
Head southwest on Mansarovar Link Rd for 180 m, passing SLICE on the right. Turn left at Paneer Chole Kulche Wala and go 13 m. Turn right at Shri Ji Chinese Fast Food Center for 8 m, then turn left. Your destination will be on the right after 30 m.
Via Gopalpura Road/Gopalpura Bypass Rd: (230 m in 3 minutes)
Head southeast on Gopalpura Rd for 19 m. Turn right at Ravi Departmental Store, passing Indori Uncle Nashta & More on the left after 120 m. Turn left at Shri Ji Chinese Fast Food Center, and your destination will be on the right after 30 m.
Address:508, 5th Floor, Jaipur Electronic Market, Riddhi Siddhi, Gopalpura Bypass Road, Jaipur, Rajasthan 302018
Timing: Monday to Friday, 9:30 AM to 6 PM.
Contact Us to Get Started
Phone:+91 92616 23456, +91 90575 82065
Email:info@niws.in, query@niws.in
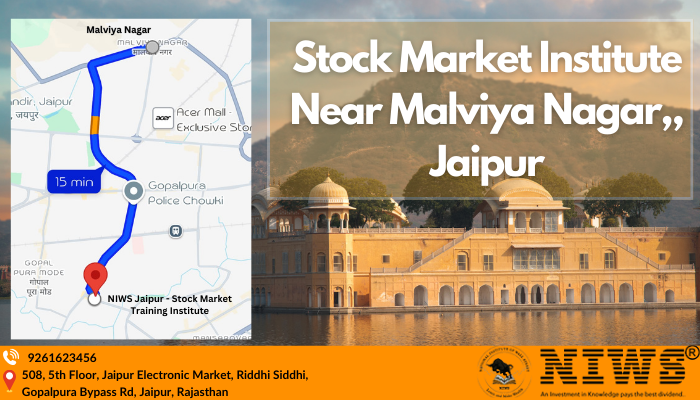
If you’re in Malviya Nagar, Jaipur, and curious about mastering the stock market, you’re in luck! NIWS (National Institute of Wall Street) is right in your neighbourhood. It is just 6.8 km in 11-minute, offering stock market courses that turn beginners into confident traders.
Whether you start a new career, side income, or just want to understand what’s happening in the markets, NIWS makes it easy. With expert instructors, hands-on practice, and flexible class timings, you’ll be ready to dive into the world of trading.
Start your journey today, and who knows? You might just become the next big name in stock trading!
NIWS (National Institute of Wall Street) is where stock market beginners and pros come to sharpen their trading skills. With over 15 years of experience, they simplify complex stock market concepts through practical courses and real-world trading sessions. NIWS offers expert guidance and job placement support, making finance careers more accessible.The institute is located in Jaipur, Delhi, and Indore.
Core Values at NIWS
At NIWS, their core values include Never-Ending Motivation for continuous learning, Integrity for honesty and transparency, Welfare to support students' success, and Service to Others by providing education that benefits the community. These values guide their mission to deliver high-quality stock market education.
Career-Oriented Courses
NIWSoffers targeted programs to jumpstart or advance your career in financial markets. Here’s a quick overview:
Global Program in Financial Market Management (GPFMM)
A comprehensive course covering global financial markets, trading, and investment strategies, ideal for international career aspirations.
6-Month Program in Financial Market Management (PFMM)
An intensive program providing foundational knowledge in financial markets, stock trading, and analysis, designed for a fast-track entry into finance.
NIWS Certified Diploma in Research Analyst
Prepares you for a career as a research analyst with skills in market data interpretation and report creation.
Research Analyst SEBI NISM Series XV Certification Module
Specialised certification meeting SEBI standards for research analysts, focusing on market analysis and regulatory compliance.
Investment Analysis & Portfolio Management
Offers deep insights into investment strategies and portfolio management, helping you maximize returns.
Certificate in Stock & Financial Markets
Introduces you to stock markets and financial instruments, perfect for beginners looking to understand investing basics.
Masters in Digital Marketing
Boost your digital marketing skills with our tailored courses for the financial sector:
Digital Marketing for Financial Professionals
Learn how to enhance your online presence, attract clients, and generate leads specifically for financial services.
SEO and Content Marketing for Finance
Master SEO techniques and content creation to improve your financial website’s search engine ranking and engage your audience.
Social Media Marketing for Financial Services
Discover strategies for promoting financial services on social media, building engagement, and driving conversions.
Corporate Training Solutions
NIWS provides training programs to elevate your team’s skills in the financial sector. Here’s how our corporate training solutions can benefit your organisation:
Customised Corporate Programs
We design bespoke training sessions to meet your specific business needs and objectives, ensuring relevant and impactful learning experiences.
On-Site Training
Our trainers come to your location, offering convenience and flexibility while delivering hands-on training directly to your team.
Corporate Certification Programs
Equip your employees with industry-recognized certifications that validate their expertise and enhance their professional credentials.
Practical Learning Experiences
Focus on real-world applications and practical skills, allowing your team to immediately apply what they’ve learned in their day-to-day roles.
Expert-led courses with over 15 years of experience
Industry-recognized certifications for beginners and pros
Hands-on training with real-time trading practice
Flexible batch timings to fit your schedule
Experienced faculty offering practical market insights
100% job placement support in finance and stock trading
Address:
508, 5th Floor, Jaipur Electronic Market, Riddhi Siddhi, Gopalpura Bypass Road, Jaipur, Rajasthan 302018
Timing:
Monday to Friday, 9:30 AM to 6 PM.
Getting to NIWS from Malviya Nagar (Pin Code - 302017) is super easy, with plenty of convenient ways to travel and simple directions to follow.
Start by heading northeast on Apex Cir toward NH21 for 1.3 km, passing by C2 Plaza on the right. Turn left onto Sansthan Path and continue for 1.4 km. The road will curve slightly left, becoming Gopalpura Bypass Rd. Pass Gopalpura Police Chowki on the left and continue for 3.9 km. At Ridhi Sidhi Circle, turn left onto Mansarovar Link Rd/Shri Hans Marg. After 180 metres, take the first left, and your destination will be on the left after 29 metres.
From apex Circle
Time: 6:53 AM — 8:08 AM
Route: Walk → Bus AC 7 → Bus 7 → Bus32 → Walk
Frequency: Every 20 minutes
Cost: ₹35.00
Phone:
+91 92616 23456, +91 90575 82065
Email:
info@niws.in, query@niws.in
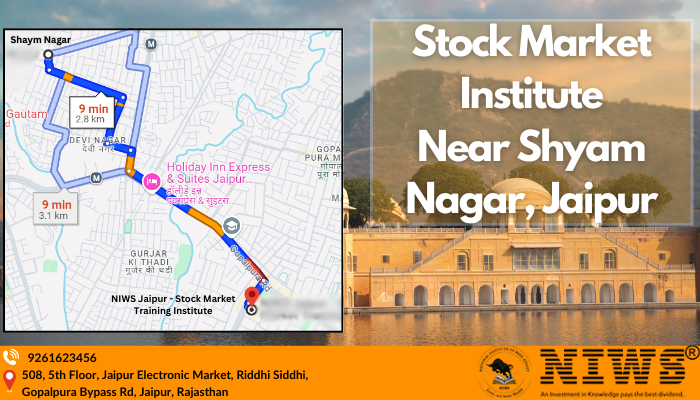
If you think the stock market is only for experts, think again! Whether you’re a fresher, a student, or a stock market enthusiast, the share market caters to everyone's interests. Right in Shyam Nagar, Jaipur, NIWS is making stock market education simple and accessible for everyone. Located just a 7-minute (2.9 km) from Shyam Nagar and a short bus ride away, NIWS is within easy reach. You don’t need to be a financial guru to start learning—NIWS guides you step by step.
NIWS is more than just an institute – it's where you build real-world skills in the stock market. With online and offline stock market courses in Jaipur that fit your schedule, you’ll be investing confidently in no time. And the best part? It’s all happening right here in Shyam Nagar!
NIWS (National Institute of Wall Street) is among the best financial institutes offering various stock markets, banking, and financial management courses. With a team of experienced professionals, NIWS equips students with practical skills in technical and fundamental analysis, wealth management, and global financial trends. They provide both classroom and e-learning platforms for a comprehensive learning experience, catering to students aiming for careers in finance both in India and abroad.
Mission: NIWS aims to create a knowledgeable financial community by offering high-quality financial education and helping individuals excel in global financial markets.
Vision: NIWS envisions developing ethical, skilled professionals who lead the financial industry, both in India and internationally, while promoting self-regulation and best practices.
In-Person Training:
Career-Oriented Courses: These courses offer a strong foundation in banking, finance, and market trading and are ideal for those starting or advancing in finance and trading. The list of courses includes -
Investor Courses: Help investors make more intelligent decisions by teaching them how to analyse market trends, manage investments effectively, and maximise returns. The list of courses includes -
Trader Courses: Focus on improving trading skills with lessons on technical analysis, reading chart patterns, and strategies for day trading. The list of courses includes -
Harmonic Trading Course: Provides knowledge on using harmonic patterns to predict market movements and improve trading accuracy.
Neo Wave & W.D. Gann Techniques: Learn advanced methods like Neo Wave theory for market prediction and W.D. Gann’s techniques for understanding market trends.
Digital Marketing Mastery: Covers all aspects of digital marketing, including SEO and social media strategies, to help you excel in the online business world. Courses include -
Digital Marketing for Financial Professionals
SEO and Content Marketing
Social Media Marketing in Finance
Online Training Options:
Advanced Options Trading: For traders who want to learn complex options strategies to increase profits and manage risks effectively.
Advanced Technical Analysis: This service offers deep insights into advanced chart patterns and technical indicators to help you make better trading decisions.
Corporate Training:
Custom Corporate Programs: Provides training solutions for businesses to enhance their teams’ financial knowledge, trading skills, and investment strategies with customised programs.
Over 10-15 years of experience in domestic and international markets.
Offers a wide range of financial, banking, and stock market programs.
Focus on real-world training and hands-on experience.
Learn on the go with an online platform and combine theory with practical in-class sessions.
Offers globally recognised certifications (NISM, NSE, BSE).
Encourages communication and leadership skills.
100% job placement guarantee.
Timing: Monday to Friday, 9:30 AM to 6 PM.
Phone: +91 92616 23456, +91 90575 82065
Email: info@niws.in, query@niws.in
Via Gopalpura Bypass Rd: (2.9 km, 7 minutes)
Start on Road No. 1 and Govind Marg for 1.2 km, then continue on Gopalpura Bypass Rd towards Keshav Vihar for 1.6 km. Turn left at the first cross street; the destination will be on your left after 29 metres.
Via Mahavir Marg/Shipra Path: (4.9 Km, 9 minutes)
Head south for 51 metres on Pano Rd, turn right, then left onto Pandit TN Mishra Marg for 750 metres. Turn left onto Gopalpura Bypass Rd for 110 metres, then right onto Mahavir Marg/Shipra Path and drive 2.5 km, passing Shani Temple. Turn left onto Mansarovar Link Rd, and after 800 metres, turn right. The destination will be on your left after 39 metres.
From Shyam Nagar (39 minutes)
Time: 5:59 AM — 6:38 AM
Route: Walk → Bus 732 → Walk
Frequency: Every 12 minutes
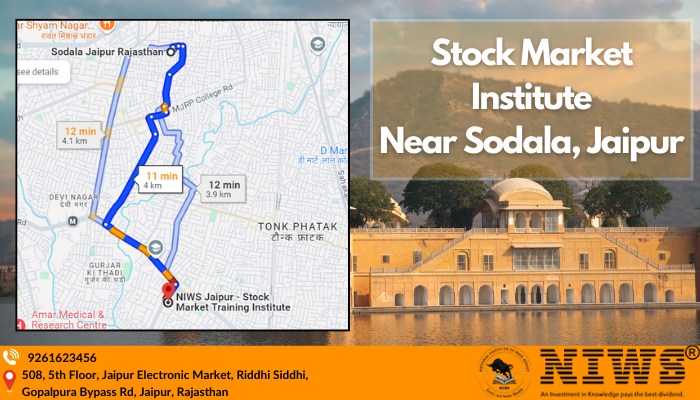
Have you ever considered investing in the stock market but felt it needed to be simplified? You’re not alone! Anyone can learn how to trade and invest smartly—you just need the right guidance. If you're in Sodala, Jaipur (302007), and want to get a real handle on the stock market, NIWS (National Institute of Wall Street) is the place to be.
NIWS offers easy-to-understand courses that take you from a beginner to a confident investor. Just clear and practical lessons to help you make money the smart way. Ready to unlock the secrets of the stock market? NIWS is here to help!
NIWS (National Institute of Wall Street) is Jaipur's leading stock market institute and is the place to go. With over 15 years of experience, they make complicated topics like technical analysis and wealth management easy to grasp. Whether you're a beginner or already familiar with the stock market, NIWS offers practical, hands-on courses to prepare you for real-world trading. Plus, they offer a 100% job placement guarantee to help you start your career.
Career-Focused Programs:
At NIWS Mansarovar, we offer a range of career-oriented courses designed to equip you with the skills and knowledge needed for a successful career in the financial markets. Our programs include:
Investor-Focused Training:
Our courses for investors are designed to enhance decision-making and portfolio management skills, catering to novice and experienced investors. Key offerings include:
Trader Development Courses:
For those looking to excel in trading, NIWS offers specialised courses that cover advanced trading strategies, technical analysis, and market prediction techniques:
Digital Marketing for Finance:
Enhance your digital marketing skills tailored for the financial sector with our specialised courses, focusing on boosting visibility and engagement for financial services:
Digital Marketing for Financial Professionals
SEO and Content Marketing
Social Media Marketing in Finance
Corporate Training Solutions:
NIWS offers training programs designed to help businesses enhance their teams' skills in the financial sector. Here’s how our corporate training solutions can benefit your organisation:
Customised Corporate Programs
On-Site Training
Corporate Certification Programs
Practical Learning Experiences
Situated in Sodala, Jaipur, at a distance of 10 minutes (4.5 km), it is easily accessible, saving you time on travel.
NIWS has over 15 years of experience with industry veterans guiding you every step of the way.
NIWS combines real-world trading practices with theoretical knowledge, making it easier to understand.
Their wide range of courses, from technical analysis to wealth management, suits beginners and advanced learners.
Courses are designed to fit around your schedule, whether you're a student or a working professional.
Address:
508, 5th Floor, Jaipur Electronic Market, Riddhi Siddhi, Gopalpura Bypass Road, Jaipur, Rajasthan 302018
Timing:
Monday to Friday, 9:30 AM to 6 PM.
Getting to NIWS from Sodala (Pin Code - 302007) is simple and easy, with many convenient travel options and clear directions.
Via New Sanganer Road: (5.2 km in about 11 minutes)
Start by heading south toward Indira Varma Rd for 400 metres. Follow Ajmer Rd for 600 metres, then take a slight left and continue for 550 metres. Follow New Sanganer Road and Gopalpura Bypass Road to Keshav Vihar for 3.5 km. Turn left at the 1st cross street; your destination will be on the left after 29 metres.
Metro Route: From Ram Nagar
Time: 5:13 AM — 6:15 AM
Route: Walk → Metro Rail Mansarovar - Badi Chaupar → Walk
Frequency: Regular
Cost: ₹12.00
Phone:
+91 92616 23456, +91 90575 82065
Email:
info@niws.in, query@niws.in
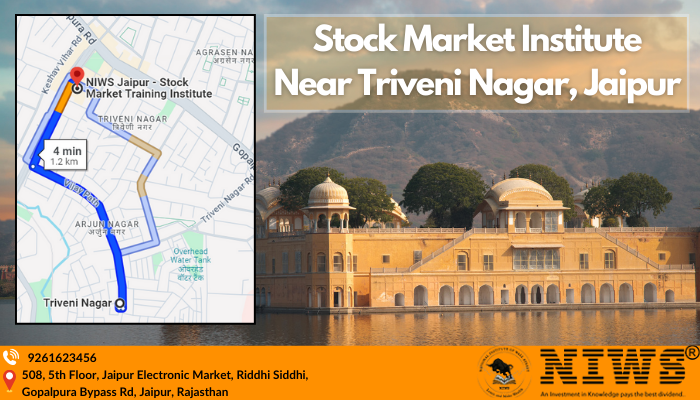
Are you living in Triveni Nagar, Jaipur, and planning to master the stock market? Look no further than NIWS, located just 5 minutes away from Triveni Nagar Jaipur.
NIWS (National Institute of Wall Street), a leading stock market institute in Jaipur, offers cutting-edge student and investor courses to turn your financial aspirations into reality. With expert trainers, hands-on learning and practical experience, NIWS brings world-class stock market education to your neighbourhood.
Don’t miss this golden opportunity to jumpstart your trading journey without stepping far from home!
NIWS—National Institute of Wall Street is one of India's top stock market institutes, offering courses in NSE, BSE, SEBI, NCFM, and NISM. With branches in Delhi, Jaipur, and Indore, NIWS provides expert-led training in banking, finance, and trading. With over 15 years of experience and a 100% job placement guarantee, NIWS equips students for success in the stock market.
Classroom Courses:
Career Courses: These courses are perfect for those who want to start or grow their careers in the stock market or finance. Learn the essentials of banking, finance, and trading to build a strong foundation. Gain skills that open doors to various roles in the financial sector.
Investor Courses: These courses help you make intelligent investment decisions by teaching you how to understand market trends, manage your investments, and increase your returns. Learn to analyse markets and create strategies that suit your investment goals.
Courses for Traders: Designed to improve your trading skills, focusing on how to read charts, understand technical analysis, and succeed in day trading. Develop practical strategies to enhance your trading performance and achieve better results.
Harmonic Trading Courses: This is for those who want to learn advanced trading techniques using specific patterns to predict market changes. Master the art of identifying patterns that can signal future market movements.
Digital Marketing Master Course: A complete guide to digital marketing, from SEO to social media, for anyone looking to succeed in the online business world.
Digital Marketing for Financial Professionals
SEO and Content Marketing
Social Media Marketing in Finance
Online Courses:
Options Trading Course: For traders who want to master options trading, this course covers strategies to help you make more money and reduce risks. Learn to navigate complex options strategies and enhance your trading edge.
Advanced Technical Analysis Course: This course is excellent for those who want to improve at trading by learning about complex charts, indicators, and strategies to make informed decisions in the stock market. Gain advanced skills to analyse market trends and improve your trading accuracy.
Corporate Training:
NIWS offers customised corporate training in financial markets tailored to the needs of companies in the BFSI sector. The courses cover everything from basic market knowledge to advanced trading strategies, ensuring employees gain practical skills relevant to their jobs. Training can be conducted at NIWS branches or corporate premises, making it flexible and accessible.
NIWS is just 1.6 km, 5 minutes away from Triveni Nagar, Jaipur, making it convenient for residents to attend classes regularly.
Learn from seasoned professionals with real-world experience in the stock market.
From basics to advanced strategies, NIWS covers all aspects of trading and investment.
Benefit from NIWS's 100% job placement guarantee in the financial industry.
Choose from weekend and evening classes that fit your lifestyle.
Address:
508, 5th Floor, Jaipur Electronic Market, Riddhi Siddhi, Gopalpura Bypass Road, Jaipur, Rajasthan 302018
Timing:
Monday to Friday, 9:30 AM to 6 PM.
Phone:
+91 92616 23456, +91 90575 82065
Email:
info@niws.in, query@niws.in
Reaching NIWS from Triveni Nagar (Pin Code - 302018) is straightforward and hassle-free, with multiple routes and transport choices at your availability.
Via Vijay Path: (1.6 km in about 5 minutes)
Start by heading north for 39 metres, then turn left and drive 50 metres. Turn right at Government Upper Primary School for 230 metres, then left at Nova Clinic toward Triveni Nagar Road for 17 metres. Turn right at VDi Edprovise.com, passing Dr. Ashish Agarwal (91 metres). Turn left at Airbnb - A396 Triveni Nagar Road and continue 230 metres. Turn right at Sanjay Dental Clinic onto VijayPath for 550 metres, then right at Prime Library. NIWS Jaipur will be on the right after 400 metres.
Via Gopalpura Road/Gopalpura Bypass Rd: (1.8 km in about 5 minutes)
Start by continuing to Triveni Nagar for 5 minutes (1.1 km). Follow Gopalpura Road/Gopalpura Bypass Rd to Keshav Vihar for 2 minutes (650 metres). Turn left at the first cross street, and your destination will be on the left after 29 metres.
Walk 1.4 km in about 20 minutes.
Head north for 39 metres, then left at Anganwadi. Turn right at Government Upper Primary School (230 metres), left at Nova Clinic (17 metres), and right at VDi Edprovise.com (91 metres). Turn left onto Triveni Nagar Rd (49 metres), right at Student Villa Pg for Boys (400 metres), and left at Sabil Marg (450 metres). NIWS is on the left after 96 metres at Ram Niket.
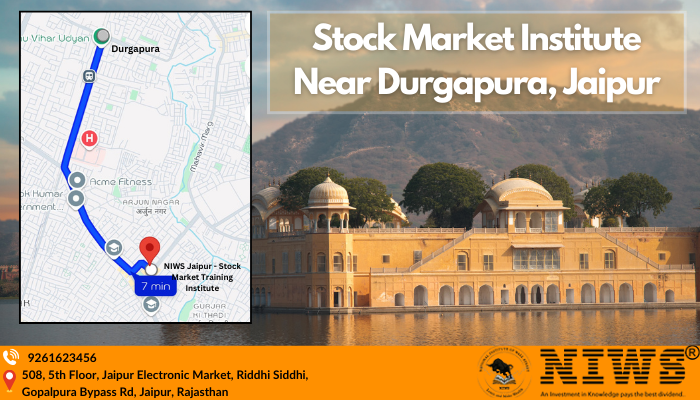
Ever wondered how the stock market really works? Imagine learning how to handle the ups and downs of the financial world with ease, just a quick 8-minute drive at a distance of 4.5 km from your home in Durgapura, Jaipur.
At NIWS (National Institute of Wall Street), they break down the stock market in a way that’s easy to understand. Whether you’re completely new or already know a bit, their courses help you gain the confidence to trade like a pro. Ready to start your journey to financial freedom? Let’s do it together at NIWS!
NIWS (National Institute of Wall Street) is Jaipur's leading stock market institute that teaches finance and the stock market. Their experienced teachers, who have 10-15 years of experience, offer a variety of courses; NIWS provides a range of courses covering everything from banking and portfolio management to technical analysis and AI-driven trading.
Formula for Success at NIWS, Jaipur
Experienced Veteran Teachers + Exceptional Learning Environment + Targeted Courses = Extraordinary Results.
At NIWS, They make mastering finance easy and effective. If you're looking for a simple yet powerful program to excel in the financial world, you’ve found the right place. Their success stories prove that their approach works!
Career Oriented Courses
These courses are designed to give you the essential skills and knowledge to kickstart and advance your career in finance and the stock market:
Global Program in Financial Market Management (GPFMM): A comprehensive course covering global financial markets tailored for those aiming to excel in international finance.
6-Month Program in Financial Market Management (PFMM): A focused, short-term program offering practical insights into financial market management.
NIWS Certified Diploma in Research Analyst: Equip yourself with essential research skills to analyze market trends and make informed decisions.
Research Analyst SEBI NISM Series XV Certification Module: Gain certification that aligns with SEBI standards, which is essential for aspiring research analysts.
Investment Analysis & Portfolio Management: Learn to assess investment opportunities and manage portfolios effectively.
Certificate in Stock & Financial Markets: A foundational course that builds your understanding of stock and financial markets.
Investor-Focused Courses
These courses are for investors looking to make informed and smart investment choices, from beginner to advanced levels:
NIWS Certified Advanced Level Smart Investment and Trading Professional: Advanced strategies and insights for investors aiming to maximize returns.
NIWS Certified Smart Investment & Trading Professional: A balanced program combining the essentials of smart investing and trading.
NIWS Certified Fundamental Analysis: Dive into the principles of fundamental analysis to better understand stocks and market trends.
NCFM Certification Preparation Module: Prepare for the NCFM certification with focused training.
Fundamental Analysis Crash Course: A quick, intensive course designed to build your fundamental analysis skills rapidly.
Trading Mastery Programs
These specialized courses are for those looking to master trading with strategies and techniques to handle different market conditions:
NIWS Certified Technical Analyst: Learn the art of technical analysis to predict market movements and enhance trading success.
NIWS Certified Options Strategy Professional: Master options trading with strategies designed to leverage market opportunities.
NIWS Certified Smart Investment & Trading Professional: A dual-focus program that blends investment fundamentals with trading strategies.
Technical Analysis Crash Course: A fast-track course designed for those who need a solid grounding in technical analysis in a short time.
Pro Elliott Wave Trading Course: Master the Elliott Wave Theory to predict market trends and turning points accurately.
WD Gann Trading Course: Learn the legendary techniques of WD Gann for precise market predictions and enhanced trading strategies.
Harmonic Trading Course: Improve your market timing by mastering harmonic patterns, which is crucial for identifying trading opportunities.
NEoWave Stock Market Course: Elevate your trading with advanced Neo Wave Theory, a refined version of the Elliott Wave Principle, designed for serious market analysts and traders.
Benefit from a comprehensive and up-to-date curriculum that covers the latest market trends and strategies.
Utilize advanced learning tools and resources, including trading platforms and software.
Analyze real market case studies to understand practical applications of theoretical concepts.
Access affordable education with flexible payment options tailored to your needs.
Benefit from a team of dedicated support staff available to assist with any queries or issues throughout your course.
Address: 508, 5th Floor, Jaipur Electronic Market, Riddhi Siddhi, Gopalpura Bypass Road, Jaipur, Rajasthan 302018
Timing: Monday to Friday, 9:30 AM to 6 PM.
Phone: +91 92616 23456, +91 90575 82065
Email: info@niws.in, query@niws.in
Via Dalda Factory Rd and Shipra Path: (4.5 km, 8 minutes)
Head west on Dalda Factory Road for 1.4 km, passing the petrol pump. Turn right toward Shipra Path and continue for 2.1 km. Turn right onto Mansarovar Link road, drive 800 meters, then turn right. Your destination will be on the left after 39 meters.
Via Gopalpura Road/Gopalpura Bypass Rd: (3.7 km, 8 minutes)
Head west on Dalda Factory Rd for 350 meters. Continue driving for 500 meters, then take Gopalpura Road/Gopalpura Bypass Rd for 2.8 km to Keshav Vihar. Turn left at the first cross street. Your destination will be on the left after 29 meters.
Bus Route 1: From Maharani Farm
Time: 6:36 AM — 7:32 AM
Route: Walk → Bus 34 → Walk
Frequency: Every 30 minutes
Cost: ₹10.00
Bus Route 2: From Triveni Chauhara
Time: 6:36 AM — 7:22 AM
Route: Walk → Bus 723A → Walk
Frequency: Every 12 minutes
Cost: ₹10.00


Start with a demonstration class.