![]() 13 Jun 2024
13 Jun 2024
Power of Elliott Wave Theory in Predicting Market Trends

 By Umesh Sharma
![]() Posted on 13 Jun 2024
Posted on 13 Jun 2024

In the dynamic world of financial markets, accurately predicting market trends can significantly enhance trading success. One of the most powerful tools for this purpose is the Elliott Wave Theory, which helps traders and analysts understand market psychology through identifiable wave patterns.
At NIWS, our expert stock market traders are ready to guide you through the benefits and applications of the Elliott Wave Theory in our exclusive pro course. Learn how this powerful theory can transform your trading strategies and market analysis, giving you the edge to succeed.
Join our pro-Elliott Wave course today and start mastering the art of market prediction! Transform your trading strategies with insights from our seasoned professionals and confidently make informed decisions. Don't miss this opportunity to elevate your trading game and achieve greater financial success.
Enroll now at NIWS and take the first step towards becoming a proficient trader with the Elliott Wave Theory!
Top 5 Benefits of Using Elliott Wave Theory in Predicting Market Trends
Elliott Wave Theory helps predict market trends by identifying patterns in market prices, called waves, which reflect the collective psychology of investors. The theory suggests that market prices move in a repetitive cycle of eight waves: five waves moving up (impulse waves) and three waves moving down (corrective waves).
By studying these wave patterns, traders can predict future price movements and make smarter trading decisions. Here are the benefits of using Elliott Wave Theory in predicting market trends!
1. Most Accurate Predictive Power
Forecasting Market Movements:
Elliott Wave Theory provides a structured approach to forecasting future price movements by identifying wave patterns. For example, an analyst can identify a five-wave impulse pattern, which typically indicates a continuing trend, followed by a three-wave corrective pattern suggesting a temporary reversal. By understanding these patterns, traders can decide when to enter or exit positions.
Early Trend Identification:
Recognizing wave patterns early allows traders to enter or exit positions before major price movements occur. For instance, spotting the beginning of wave 3 (the most powerful wave in the trend) early can allow traders to capitalize on significant price movements.
2. Detailed Market (Multi-Timeframe) Analysis
Elliott Wave Theory’s fractal nature means wave patterns repeat on different scales. This allows traders to analyze market trends across multiple timeframes, from short-term to long-term, giving a comprehensive view of the market.
How Does Multi-Timeframe Analysis Work?
Traders study market trends using different timeframes. For example, they might use a weekly chart to understand the overall trend and a daily chart to find specific buying or selling opportunities within that trend.
Example:
-
Weekly Chart (Long-Term): A trader sees a stock rising over several weeks, indicating a long-term upward trend.
-
Daily Chart (Short-Term): The trader notices short-term downward corrections on the daily chart within this upward trend. These corrections are opportunities to buy at a lower price before the stock continues to rise.
By analyzing both long-term and short-term charts, traders can:
-
Confirm the overall direction of the market.
-
Identify the best times to enter or exit trades.
-
Align their strategies with the broader market trend while taking advantage of short-term movements.
This multi-timeframe approach provides a more detailed and accurate market analysis, helping traders make better-informed decisions.
3. Enhanced Market Trend Predictability with Other Technical Tools
When Elliott Wave Theory is combined with other technical analysis tools, it improves the accuracy and reliability of market predictions. Here’s how it works with some popular tools:
Fibonacci Retracements:
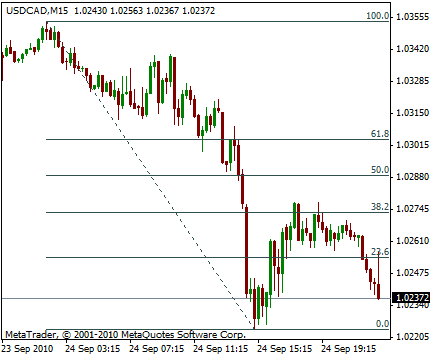
These horizontal lines indicate potential support and resistance levels where the price might pause or reverse after a significant move. They are based on Fibonacci numbers, a mathematical sequence.
-
How it helps: If Elliott Wave Theory predicts a wave ending at a certain point, and that point aligns with a key Fibonacci retracement level (like 38.2%, 50%, or 61.8%), it adds extra confidence that the market will reverse at that level.
-
Example: If a stock has risen from $100 to $200 and starts to fall, Fibonacci retracement levels suggest it will find support around $161.80 (a 61.8% retracement of the move). If this level also aligns with an Elliott Wave pattern suggesting the end of a corrective wave, the likelihood of a reversal increases.
Moving Averages (MA):
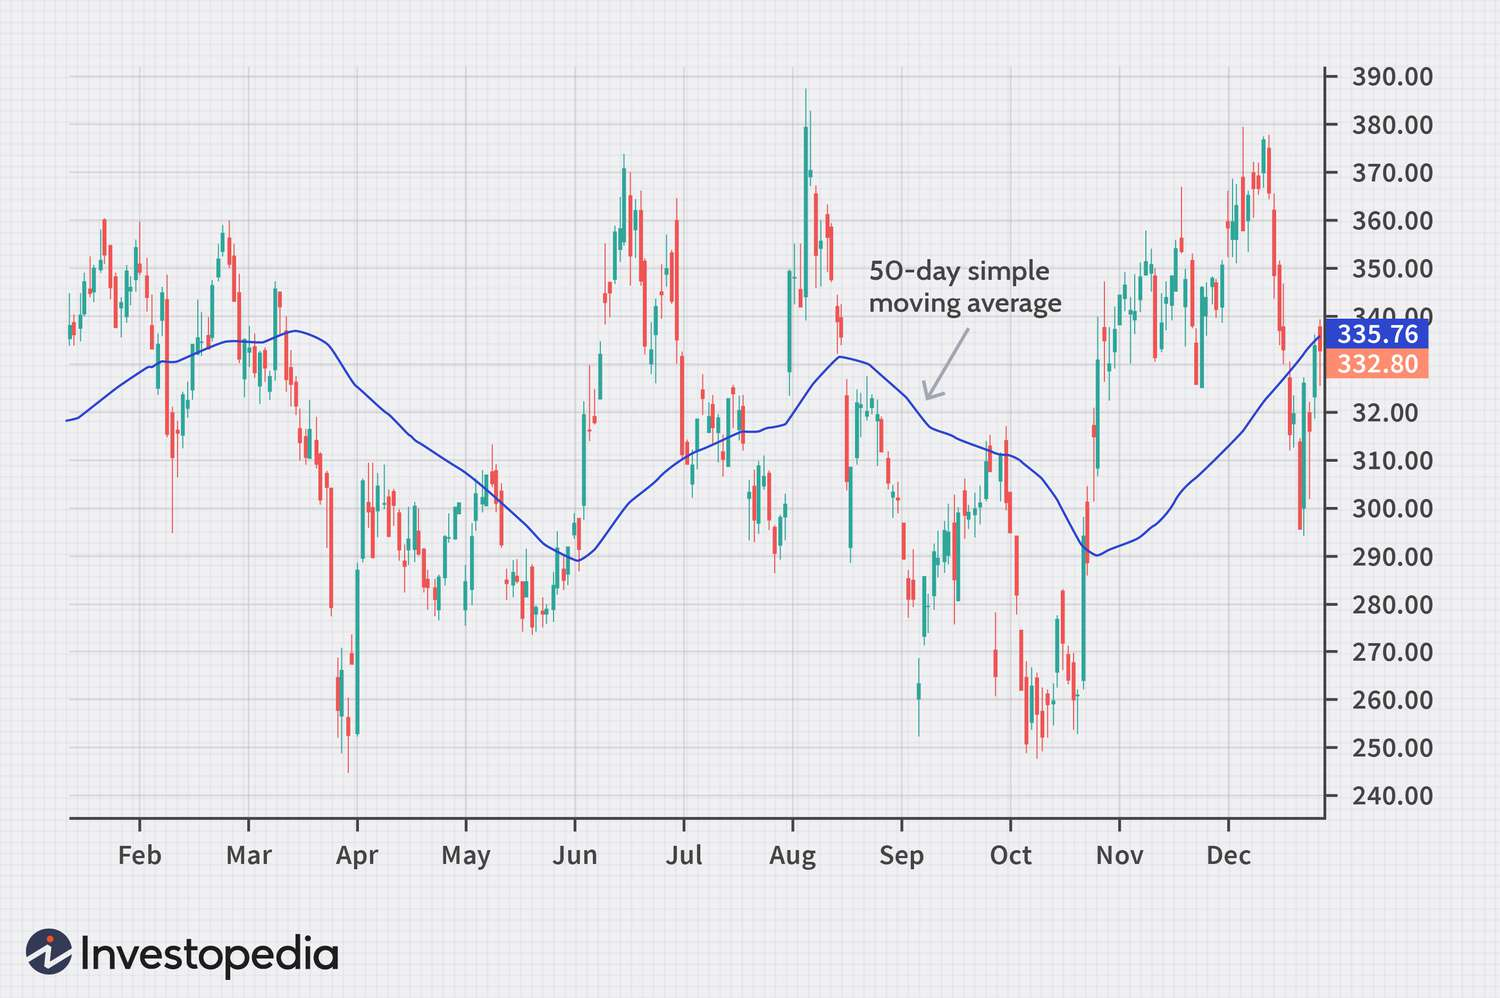
These lines smooth out price data to help identify trends over time. A simple moving average (SMA) is the average price over a set number of days, while an exponential moving average (EMA) gives more weight to recent prices.
-
How it helps: If an Elliott Wave pattern indicates a bullish trend and the price crosses above a moving average, it confirms the trend.
-
Example: If the price is above the 50-day SMA and Elliott Wave Theory predicts the start of a new upward impulse wave, the moving average acts as an additional confirmation of the trend.
Relative Strength Index (RSI):
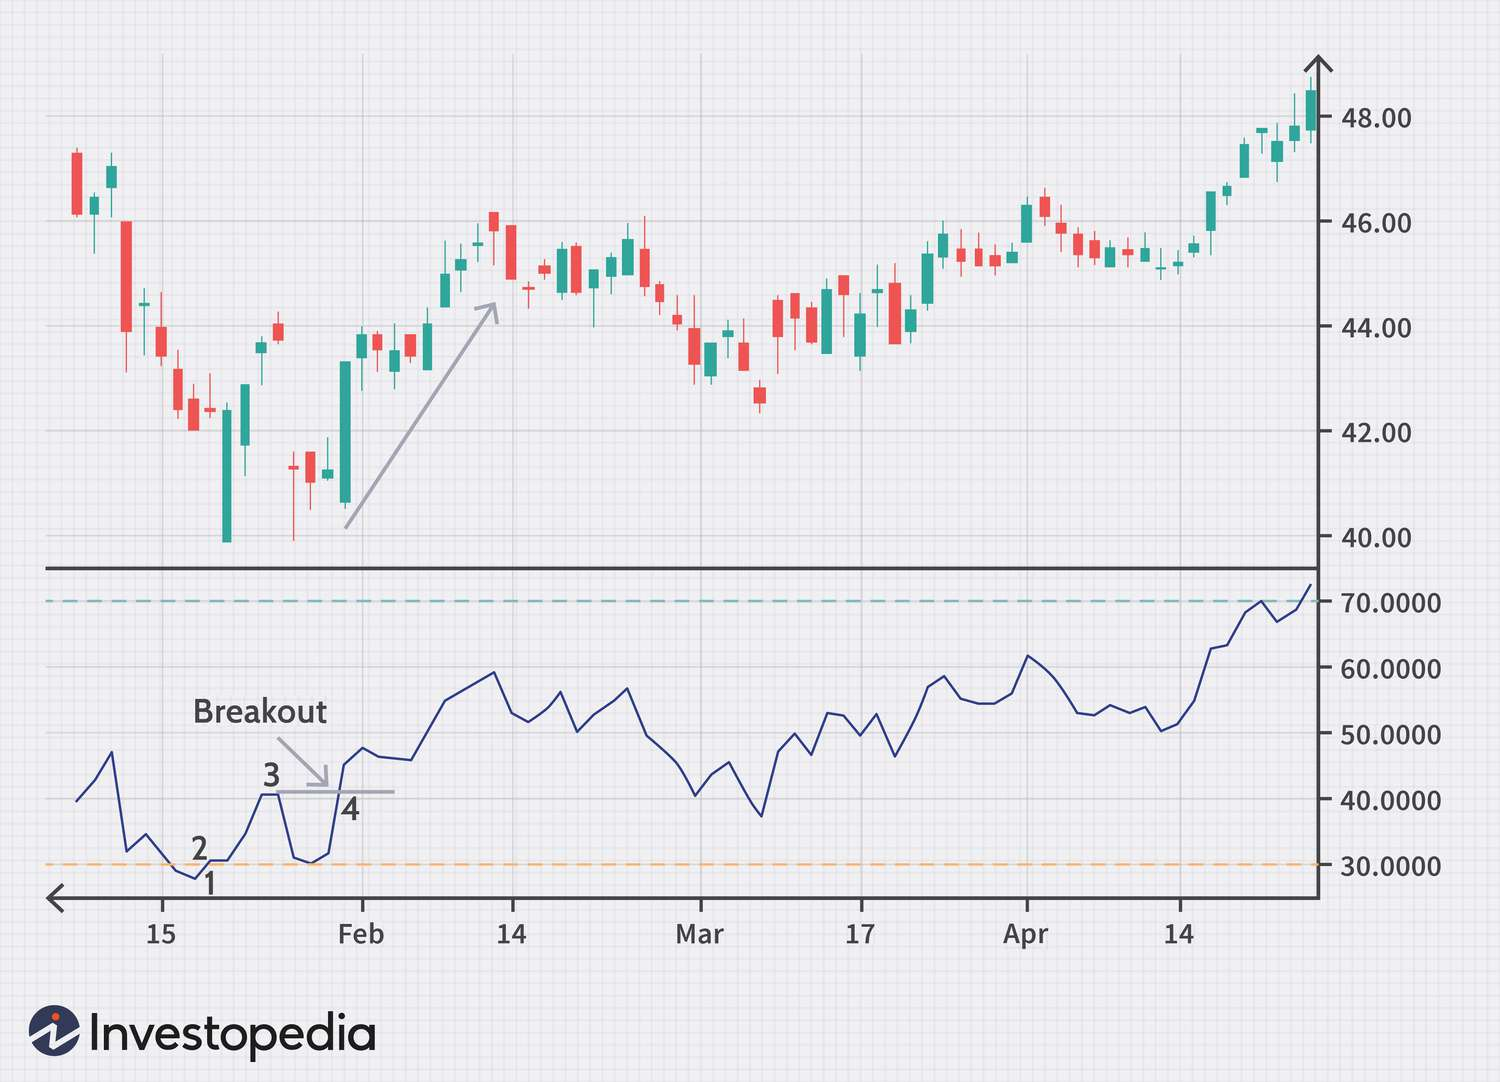
This momentum indicator measures the speed and change of price movements. It ranges from 0 to 100, with levels above 70 indicating overbought conditions and below 30 indicating oversold conditions.
-
How it helps: If the Elliott Wave Theory suggests a market is nearing the end of an impulse wave, and the RSI shows overbought conditions, it signals a potential reversal.
-
Example: If an Elliott Wave analysis indicates that a stock is completing its fifth wave (final upward wave), and the RSI is above 70, it suggests the stock might soon reverse and enter a corrective phase.
Moving Average Convergence Divergence (MACD):
This indicator shows the relationship between two moving stock price averages. It consists of the MACD line, the signal line, and a histogram showing the difference between them.
-
How it helps: If Elliott Wave Theory suggests a new wave begins, and the MACD line crosses above the signal line, it confirms the new trend.
-
Example: If Elliott Wave analysis predicts the start of an upward impulse wave, and the MACD line crosses above the signal line, it confirms the bullish trend.
By combining Elliott Wave Theory with these technical analysis tools, traders can develop a more robust and comprehensive trading strategy, leading to more reliable and informed market predictions.
4. Risk Management
Identifying Reversal Points
Elliott Wave Theory helps traders identify potential reversal points in the market, allowing them to set precise stop-loss and take-profit levels. This enhances risk management by providing clear guidelines on when to exit trades.
Example:
-
End of Wave 5: When traders recognize the end of an impulse wave (wave 5), they can set a stop-loss order just beyond this point. If the market moves against them, their losses will be limited to a predetermined amount.
-
How it helps: By identifying the end of wave 5, traders can avoid staying in a position too long and protect their profits. They set stop-loss orders to automatically sell if the price goes below a certain level, minimizing potential losses.
Mitigating Losses
The Elliott Wave Theory helps traders avoid significant losses and protect their capital by predicting market corrections and trend reversals. Knowing when a trend will change allows traders to exit positions before adverse movements occur.
Example:
-
Start of a Corrective Wave: If a trader identifies the beginning of a corrective wave, they can choose to exit their position before the market starts moving against the initial trend. For instance, if a trader sees an upward trend is ending and a corrective wave is about to begin, they can sell their assets to avoid the downturn.
-
How it helps: This proactive approach allows traders to preserve their capital and avoid riding out potentially long and unprofitable market corrections. By exiting positions early, they can lock in gains and avoid the emotional and financial stress of watching their profits erode.
By identifying reversal points and predicting market corrections, traders can set precise stop-loss and take-profit levels, mitigating losses and protecting their capital.
5. Adaptability Across Markets
Elliott Wave Theory applies to various financial markets, including stocks, forex, commodities, and cryptocurrencies. This adaptability makes it a valuable tool for diverse trading portfolios. For example, the same wave patterns observed in stock markets can be applied to forex markets, providing consistent analytical frameworks.
Consistent Patterns:
Elliott Wave Theory provides a reliable method for long-term market analysis due to its consistent patterns across various market conditions. Whether the market is rising (bull market) or falling (bear market), the wave patterns—five-wave impulses and three-wave corrections—remain the same.
This consistency allows traders to apply the same analysis techniques regardless of market direction, making predicting trends and developing strategies easier. As a result, traders can confidently use the Elliott Wave Theory to navigate bullish and bearish markets effectively.
Conclusion
Elliott Wave Theory, taught at leading stock market institutes in Jaipur, offers significant benefits for predicting market trends, making it an invaluable tool for traders and analysts. Its predictive power, detailed analysis framework, and adaptability across various markets provide a comprehensive approach to market forecasting. The theory's ability to enhance technical analysis and support risk management is crucial to successful trading strategies.
Consider professional training and education to leverage Elliott Wave Theory's benefits fully. Opting for professional stock market courses in Jaipur is essential to trading in the stock market.
Our experts at NIWS are here to help those residing in Jaipur or Delhi. Explore our comprehensive stock market courses and resources to become proficient in market analysis and elevate your trading strategies.
By Umesh Sharma
MBA with 22 years of experience in Banking and Financial markets with expertise in marketing, administration, sales and training. He is working as Director, of marketing operations and wealth management in NIWS. He always innovates new ideas with a positive attitude and long-term vision, making him a key asset to the team NIWS. He is of firm belief that one can achieve goals by ethics, integrity and passion.