![]() 04 Feb 2023
04 Feb 2023
HOW ARE BULLISH CANDLESTICK PATTERNS FORMED

 By Umesh Sharma
![]() Posted on 04 Feb 2023
Posted on 04 Feb 2023
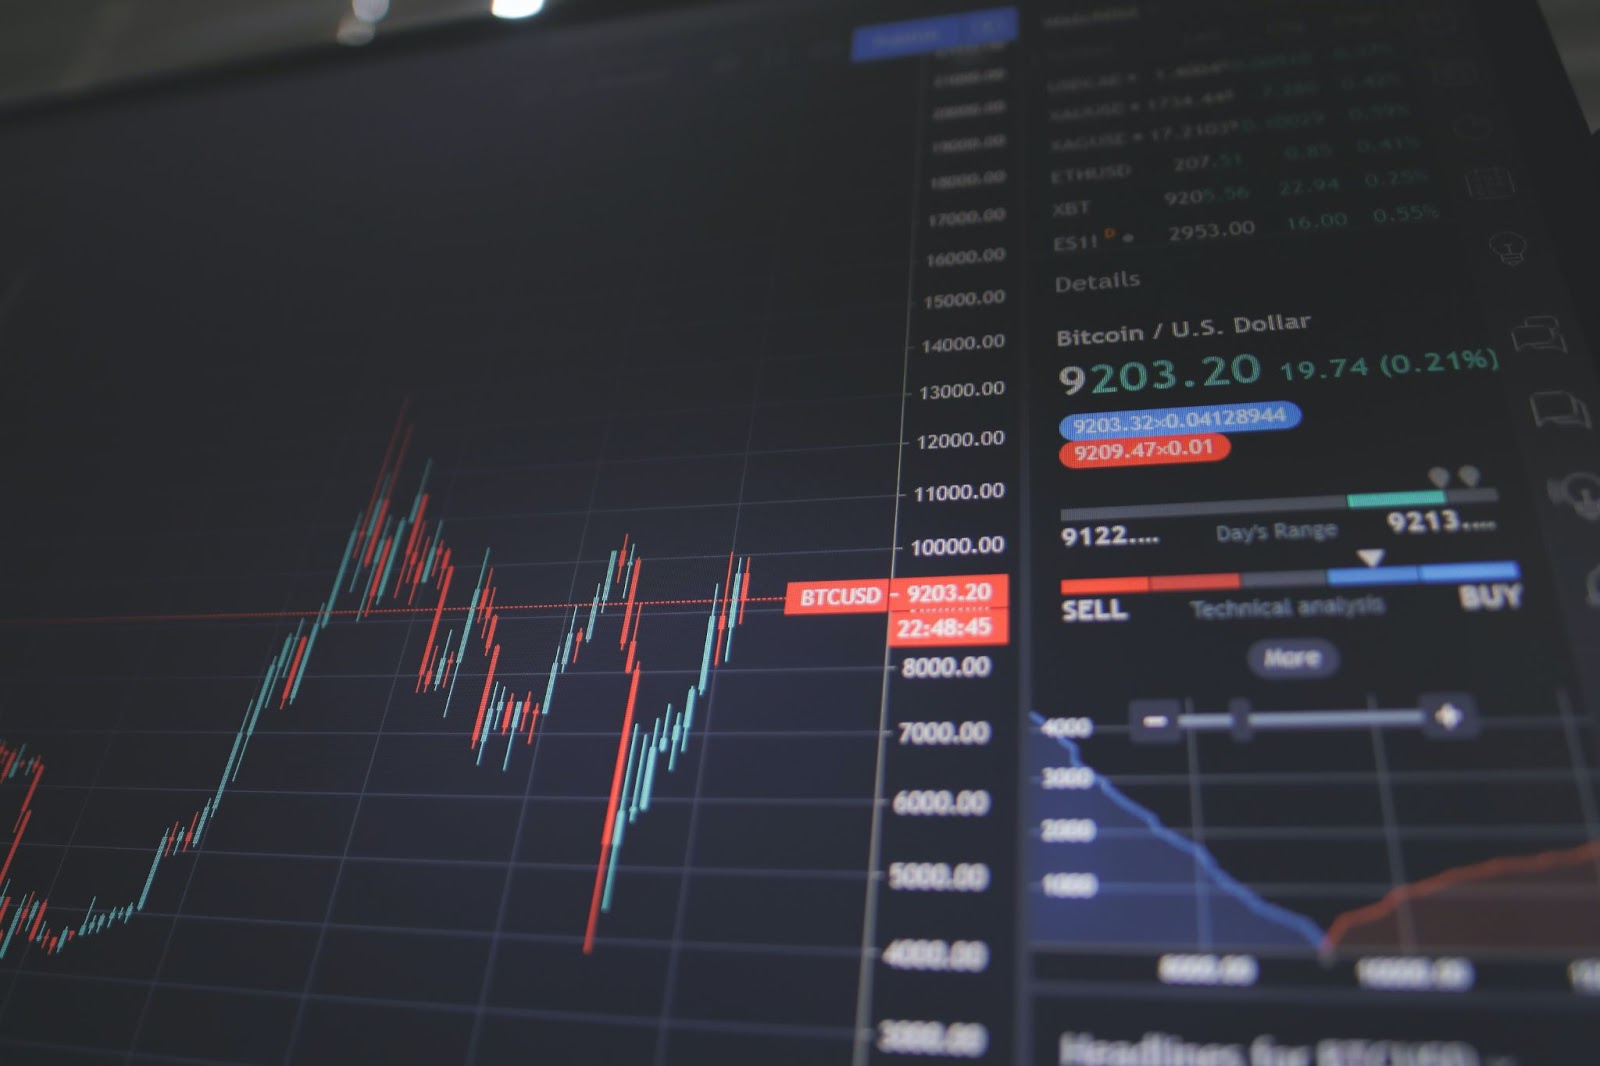
Candlestick charts are financial charts designed to track securities' movement. They have been helping traders since the ancient age when there were rice trades in Japan. But today, they have become highly relevant to price charting.
Candlestick charts enable traders and investors to interpret market actions more efficiently. Candlesticks can be categorized into different patterns, including bullish candlestick formations. These formations can help traders make informed purchasing and selling decisions.
The bullish candlestick pattern denotes the ongoing downtrend and can quickly reverse to an uptrend. However, it can also involve multiple and single candlestick patterns. By analyzing bullish candlestick formations, you can identify the long trade entry points and enhance your trading strategies.
To learn about candlestick patterns and other stock trading techniques, you can rely on the systematic training of NIWS. We offer reliable share market training in Indore for traders, courses for investors, and other career-oriented course options. You can easily choose from the multiple options to become a pro at NIWS.
Book your Free Online Demo now to learn more.
What Are Bullish Candlestick Patterns?
Bullish candlestick formations are created when there is a downtrend in the market. They also signal the price reversal movement. Traders use these formations as indicators to open a long position and gain profit from an upward trajectory.
To be bullish, you must be involved in purchasing an underlying market. It is intended to profit from your sale in the market when the price is on the rise
Technical analysts think that stock prices trade in different patterns. The most significant factor behind the stock’s movement is humans. However, it is essential to analyze the trading activities and data on charts to decide. So, you need to identify bullish candlestick formations for effective stock trading.
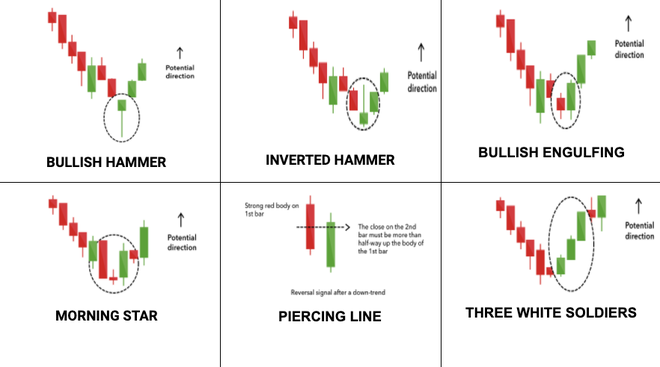
The Best Bullish Candlestick Patterns-
Individual candlesticks create patterns used by traders to find significant resistance levels. Moreover, several candlestick patterns give you the best opportunity in the market. Some candles also show continuation patterns. Find the details of the most popular Bullish candlestick pattern to decide on the stock trading activities.
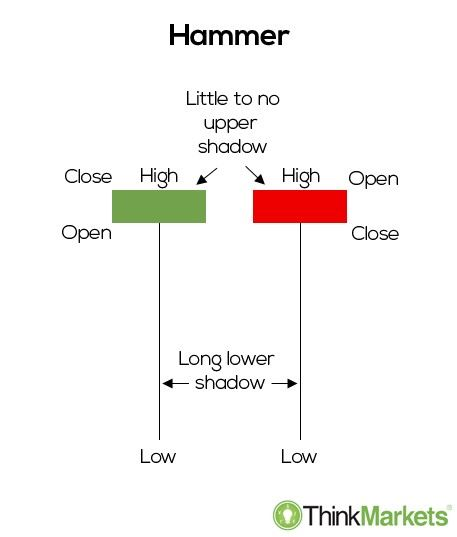
Hammer Pattern-
Overview-
This bullish reversal pattern is trendy among traders who like to identify the right price action of securities. Several traders use the candlestick to detect the price reversal points. Furthermore, candlesticks work effectively in almost any financial market.
You have to detect the price direction based on the price action evaluation. When applied properly, this strategy can earn you more money.
How To Spot?
- This single candlestick pattern is easily identifiable due to the small body of candles. The green ones indicate that the close of the sticks is higher, while the red bearish ones are about the lower closing of the candle.
- The candlestick colour does not have much weight, as the pattern displays a bullish signal irrespective of the candle colour.
- The candlestick’s success rate can vary according to the length of the wick.
- The wick length is longer than the candle’s body for an excellent bullish candlestick pattern.
Pros-
- Show price trends in financial markets like indices, stocks, and cryptocurrencies.
- The hammer is complementary to other price action tools.
- It can be used as both a reversal pattern and trend continuation.
- There is a high potential to show a market reversal.
Cons-
You can never rely only on a hammer to get the best price.
The Piercing Line:
Overview-
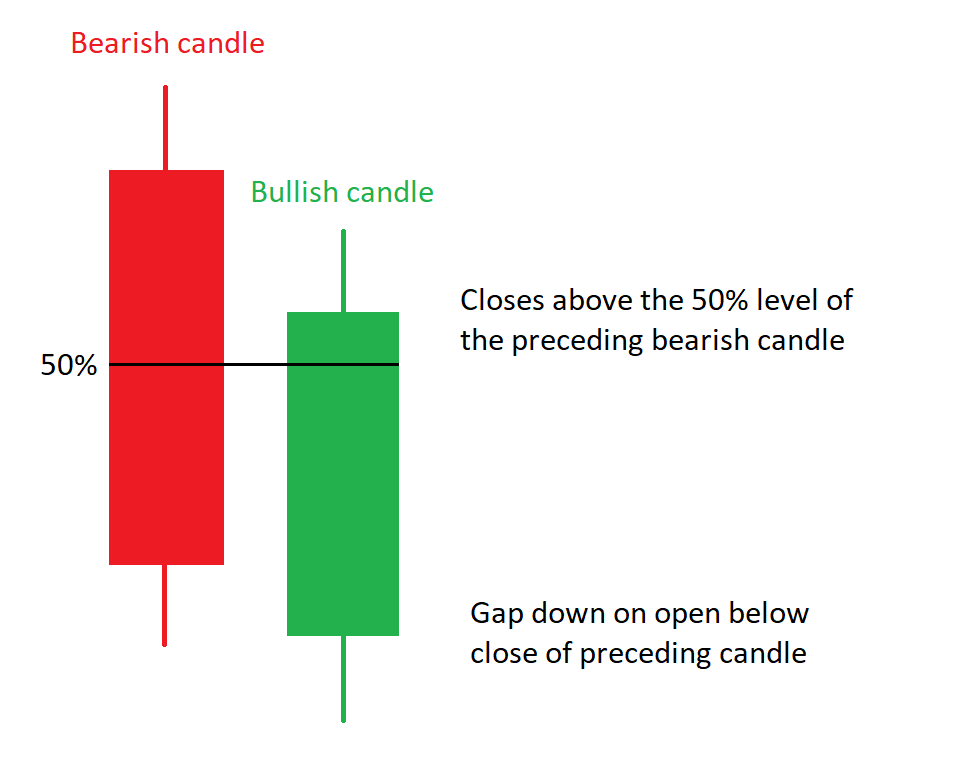
At the end of the bearish candlestick trend, you can notice the Piercing Line candlestick pattern. You can use the pattern to detect potential reversal zones. There are two consecutive candles- the first one is bearish, while the second one is bullish. The wicks are short, whereas the bodies are long.
The second candle validates the end of the selling pressure. But, you may not find high accuracy in the candle pattern. Some traders use alternative technical analysis tools to confirm the pattern. They access the buying position after identifying the pattern.
How to Spot?
You can easily spot the Piercing Line pattern by checking some characteristics-
- Found at the bottom part of the downtrend
- Add a bullish and bearish candle
- The bullish candlestick opens lower compared to the bearish candlestick’s closing point.
- The bullish one closes slightly above 50%.
Pros-
- Both professional and novice traders can detect the traders
- The risk-reward ratios are highly favourable
- You can obtain entry levels after confirming the piercing pattern
Cons-
- Represent only bullish reversal patterns
- You must use other oscillators and technical indicators to trade the piercing pattern.
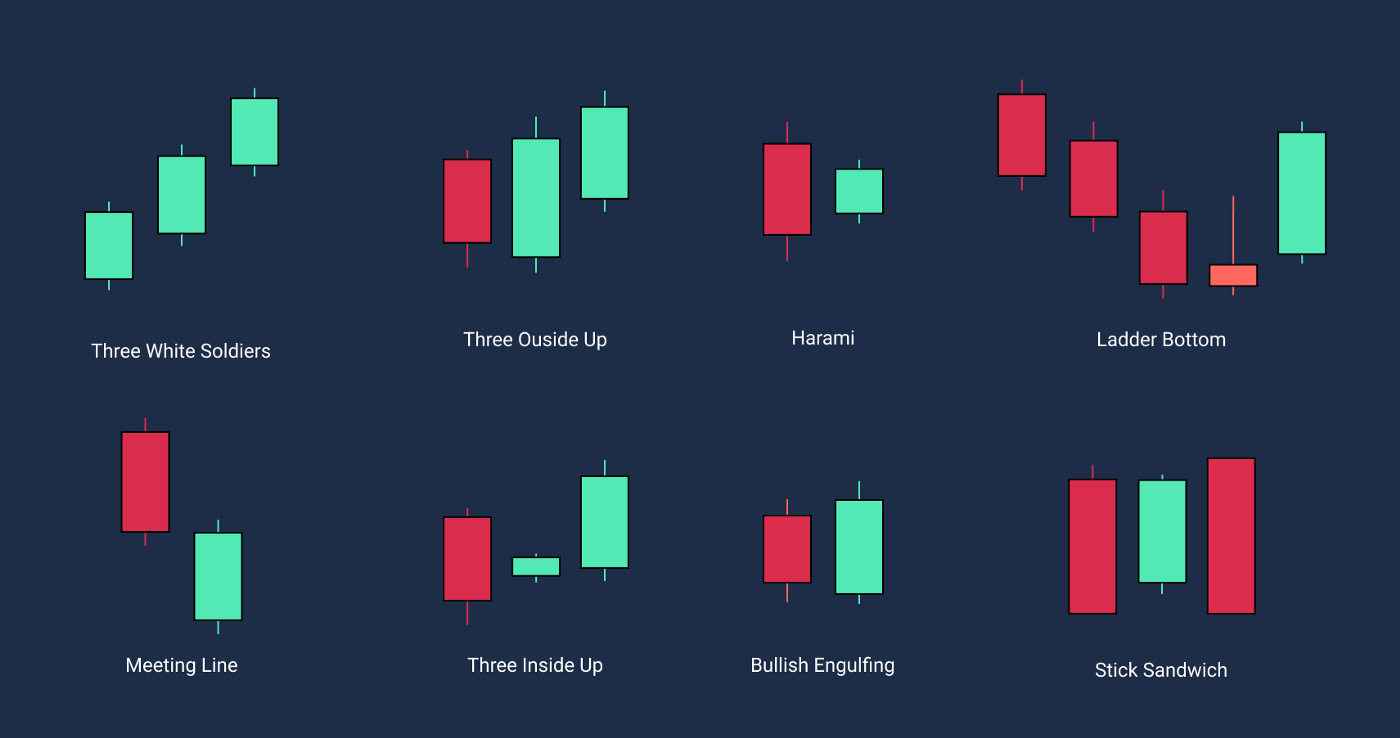
The Bullish Engulfing-

Overview -
The Bullish Engulfing candlestick signifies that there may be an increase in the buying pressure. You should not interpret the pattern as a white candlestick, which represents upward price movement. Similarly, the black candlestick signifies a downward movement in the price. The stock should open at a lower pricing rate to create this pattern.
In this pattern, the white candlestick indicates a day when bears regulate the stick price in the morning to get bulls.
How To Spot?
- There are 2 candles, and the latter one engulfs the previous candle's body.
- The engulfing candle may be bearish and bullish based on the ongoing trend.
- The bullish candle indicates the downtrend reversal and an increased buying pressure.
- Engulfing candles enable traders to spot the trend reversal
Pros-
- You can easily spot the pattern and use it in different timeframes.
- The pattern often occurs on the chart, so you will have several trading opportunities.
- Good risk-reward ratio because of short-stop losses.
Cons-
You need some skills to deal with the engulfing patterns.
The Morning Star-
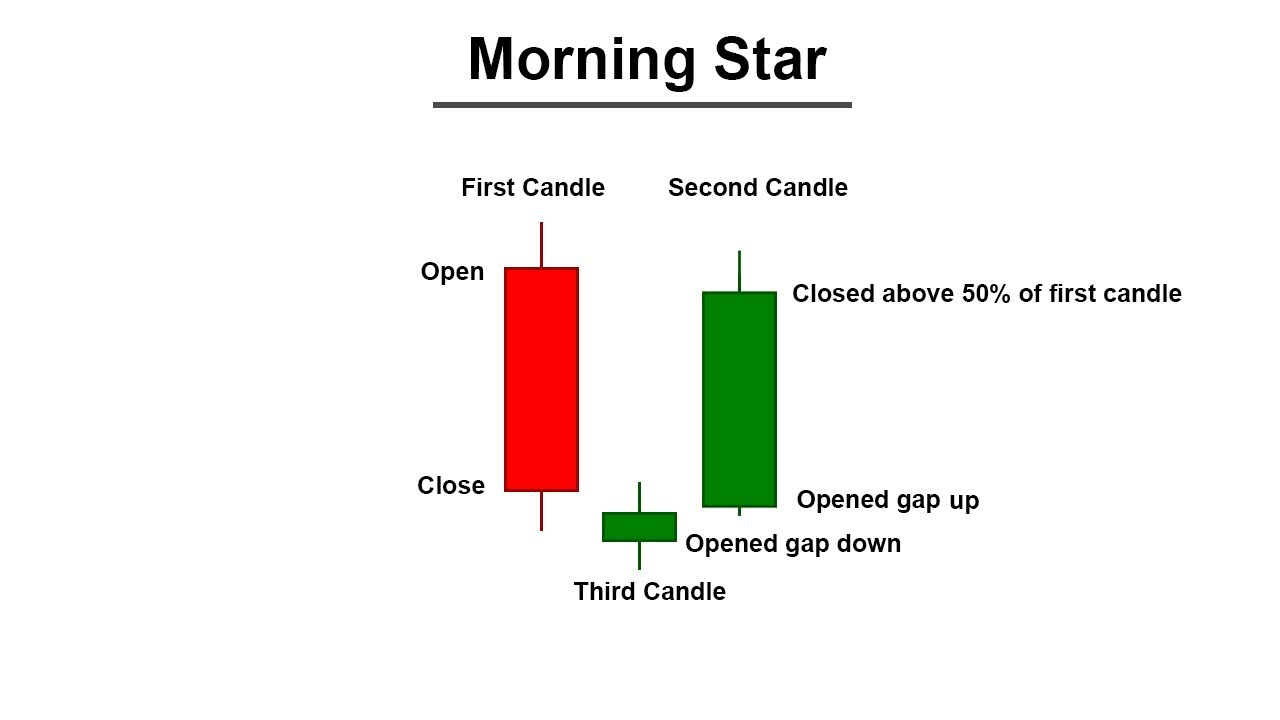
Overview –
It is a bullish reversal pattern appearing at the bottom of the downtrend. It denotes the seller's loss of momentum. Buyers can take control of the uptrend price rates. It also combines different candlesticks with a U-shaped design.
The bullish pattern is a perfect choice when the price starts moving down for a significant period. However, there will also be a reversal of momentum. 3 candles shown in the patterns have different characteristics.
- The bearish candle should be large at the downtrend bottom.
- The smaller candle may not always be bullish.
- The daily bullish candle is always large.
How to Spot?
There are some ways to identify this pattern.
Your first task is to spot the bearish trend on the chart. But, identifying the bottom is important. The bottom refers to the last part of this trend, as it is the point where bulls regain momentum. You have to analyse the bottom dynamically and horizontally.
There are 3 candles, and the second candle needs to be smaller. A bearish gap can be found when the candle opens. But, it is not mandatory to find the gap. A part of the second candle's body will be within the first candle. It is referred to as a valid pattern.
Pros-
- User-friendly technical analysis tool because there is no complicated formula to calculate the result
- There is 100% accuracy in the pattern, and the result can be interpreted without effort.
- You can use the pattern across different indices and stocks.
Cons-
- You need effort and patience while trading in your chart.
- The morning star that combines 2 candlesticks is not always easy to find.
Three White Soldiers-
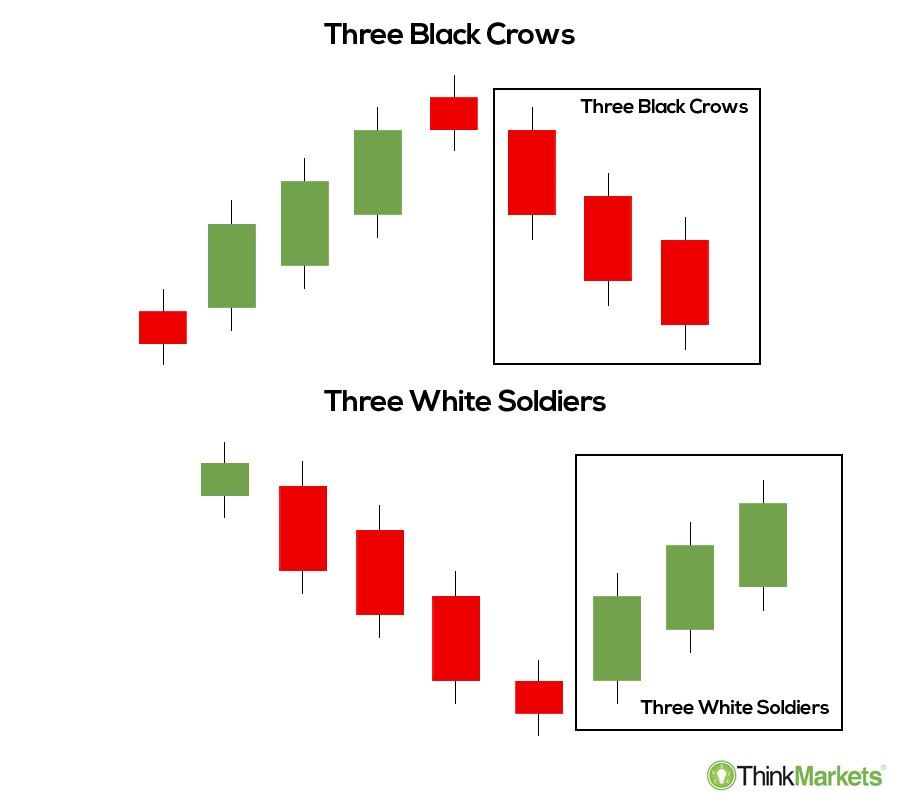
Overview-
The triple candlestick pattern can be noticed on the charts at the bottom of the bearish candlestick trend. It indicates the price reversal. According to traders, charting formation is the price reversal indicator. It also denotes the close of the selling pressure in the market.
The charting formation is also effective in detecting the slowing pace of the continuous downtrend. Traders can obtain buying potential for the asset by finding the pattern. They must take their position after working on the third candlestick.
How to Spot?
- To detect the candlestick pattern, you have to look for consecutive bullish candles, which can be found at the bottom of the downtrend.
- Each candle should have a comparatively long body. The opening price rate should be above the closing rate of the previous candlesticks, creating a V-shaped letter.
- You can use additional tools for technical analysis and ensure an accurate price reversal. Enter a good buying position while dealing with the third candle. Moreover, a stop-loss order is to be set below the low level of 1st candle’s level.
Pros-
- You can identify the pattern easily.
- The pattern is detectable at the ending part of the downtrend
- It signals a potential fluctuation in the trend direction
- A higher close of every successive candlestick reinforces the signal.
Cons-
There is no signal of 100% reversal.
Conclusion -
Bullish candlestick formations provide you with valuable signals during a reversal trend. However, to confirm the signal, it is best to use other indicators along with these bullish patterns.
Without proper training, you may find it challenging to efficiently interpret and apply bullish candlestick patterns. To master these skills, you can join the training program at NIWS, a leading stock market institute in Jaipur. We offer both online and classroom courses for traders and investors, designed to help you excel in the stock market. You may also request a free demo before paying for the course.
Connect with our experts now at +91 9261623456 to know more.
By Umesh Sharma
MBA with 22 years of experience in Banking and Financial markets with expertise in marketing, administration, sales and training. He is working as Director, of marketing operations and wealth management in NIWS. He always innovates new ideas with a positive attitude and long-term vision, making him a key asset to the team NIWS. He is of firm belief that one can achieve goals by ethics, integrity and passion.