![]() 24 Dec 2022
24 Dec 2022
What is Technical Analysis? Definition, Basics & Examples

 By Umesh Sharma
![]() Posted on 24 Dec 2022
Posted on 24 Dec 2022
Stock Market Investment is a recent trend amongst youngsters and individuals. They are showing great interest in learning more about trading strategies in the stock market. However, the stock market is highly volatile, and one needs to be well-prepared before investing money.
Investors and analysts need technical analysis to invest in the stock market. Technical analysis basics involve understanding price movements, market trends, and chart patterns, which can help make informed decisions.
Technical analysis requires proper knowledge and skills; otherwise, it will be like sailing close to the wind. For instance, a technical analysis example is using moving averages or candlestick patterns to predict market behavior and identify profitable opportunities.
When you look for an investment opportunity in the capital market, whether it's equity, mutual fund, derivatives, or commodity, technical analysis definition emphasizes its role in analyzing the fundamental, financial, and psychological aspects of the company, industry, and other market participants.
Our online advanced technical analysis course is a foolproof strategy for avoiding hazy investments and losses. With the proper knowledge and insight into successful trading strategies, you can take calculated risks for high returns.
NIWS provides the best Stock Market Course In Jaipur. We are one of the top institutes in the country specializing in financial courses, from Banking, Finance, Stock Market, Portfolio, and Wealth Management to Technical and Fundamental analysis. With over 10-15 years of experience as professionals in domestic and international markets, we strive to help students achieve their lifelong career goals and aspirations.
After completing the stock market course, you should read our blog to learn about career growth.
What is Technical Analysis?
Technical analysis is a study, tool, method, or discipline employed by the investor to predict or analyze the future price of financial instruments like shares, bonds, and stocks by studying charts, prices, volume trends, and many other factors.
It is hard to understand what technical analysis is in the stock market.
Here is an example that will help you understand:
Suppose you bought share XYZ on 1st Jan 2023. It would be best to have technical charts to help you predict the prices for the next hour, day, or month. Using tools like bar charts, line chart candlesticks, and the Fibonacci series to observe patterns, trends, and changes to forecast the price of a share in the future is a technical analysis trading skill. On the other hand, fundamental analysis helps you know more about the company's prospects.
Difference Between Technical Analysis V.S Fundamental Analysis
Technical vs Fundamental Analysis
Technical vs Fundamental Analysis
| Basis Of Difference | TECHNICAL ANALYSIS | FUNDAMENTAL ANALYSIS |
|---|---|---|
| Meaning | Technical analysis is a method of analyzing charts based on price, indicators, patterns, and statistics used to forecast the share price. | Fundamental analysis is the study of a business's fundamentals, such as the overall economy, earnings, cash flow, balance sheet, and expenses, to calculate a stock's value. |
| Focus | This analysis only focuses on pie charts, trends, history & the prices of shares. | This analysis focuses on both qualitative and quantitative factors. |
| Time Horizon | Technical analysis is a short-term approach that examines stock price movements, volume & trends. | Fundamental analysis is a long-term approach that examines data over a long period. |
| Relevancy | Technical analysis is relevant only for short-term trading. | Fundamental analysis is relevant only for long-term investing. |
| Buy & Sell | Trends, charts, indicators, support, and resistance levels are used in technical analysis to determine whether to buy a stock based on its ability to be sold at a higher price. | In Fundamental analysis, when a stock's price is undervalued, it is purchased, and when the price is overvalued, it is sold. |
| Data Collection | In Technical analysis, the company's past data is considered. | In Fundamental analysis, the company's overall historical data is considered. |
| Indicators | in Technical analysis are Trend following, support and resistance, EMA, charts, MFI & MACD. | Indicators in Fundamental analysis are (EPS) Earning per share, (FCF) Free cash flow, Price-to-earning ratio (P/E), Dividend yield ratio, and Price-to-sale ratio (P/S). |
| Types of Investors | are Short-term traders & swing traders. | Long-term investors. |
| Concepts | that are used in Technical analysis are Dow theory, Price data, Dead cat, and Chart pattern. | Concepts used in Fundamental analysis are (ROA) Return on Asset & (ROE) Return on Equity. |
| Methodology | Along with price movements of shares through charts. Technical analysis also examines the trends, emotions of people & market psychology. | The fundamental analysis examines industry trends, economic indicators, competitor analysis, company analysis, and financial data. |
Assumption of Technical Analysis
For a better understanding of what technical analysis is, let's look at the basic assumptions of technical analysis:
1) Market Discounts Everything
The technical analyst assumes that investors are aware of everything happening about a stock that affects the price beforehand by incorporating fundamental analysis; therefore, the only thing studied under technical analysis is the price movements that are affected by the forces of demand and supply, represented on charts.
2) History Tends To Repeat Itself
This second assumption of Technical analysis states that the trends are repetitive, and human behaviour and human history repeat themselves.
As the stock price pattern is repetitive, technical analysts observe the past stock price to predict future price trends by using chart patterns.
This repetitive nature of trends clearly shows fixed investor psychology.
3) Price Moves In A Trend
- Technical Analysis is based on this foundational logic known as TRADE WITH TRENDS.
- This last assumption of technical analysis shows that price follows a past trend rather than moving unevenly.
- Trends can either be Uptrend, Downtrend, or Sideways.
- Every stock chart depicts its unique trend and the stock price moves. As per this assumption, when a trend gets published, the stock price is assumed to move in a particular pattern until and unless a new trend is identified.
So, when trading and investing based on Technical Analysis, it is essential to consider all the above assumptions.
Types Of Technical Charts
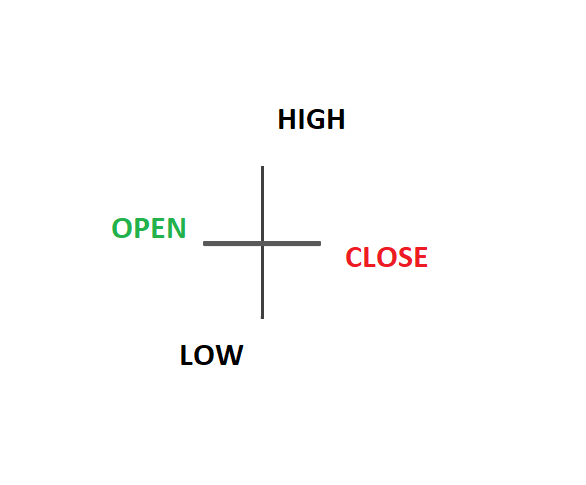
1. Bar Charts
- Bar charts are traders' most straightforward charts. They consist of a series of vertical lines that tell you about the (OHLC), i.e., the opening, high, low, and close, and mark the share price fluctuations during a particular time.
- A horizontal line showing the opening price is visible to the right of the horizontal dash; to the left, it shows the closing price.
- Red lines indicate a lower closing price than the opening price. If the closing price exceeds the opening, the line is shown in black or green colour.
2. Line Chart
Charts like this connect different closing prices. They are fundamental forms of technical analysis that experts use.
The best thing about this chart is that it helps the investor to get the big picture of past and present asset prices.
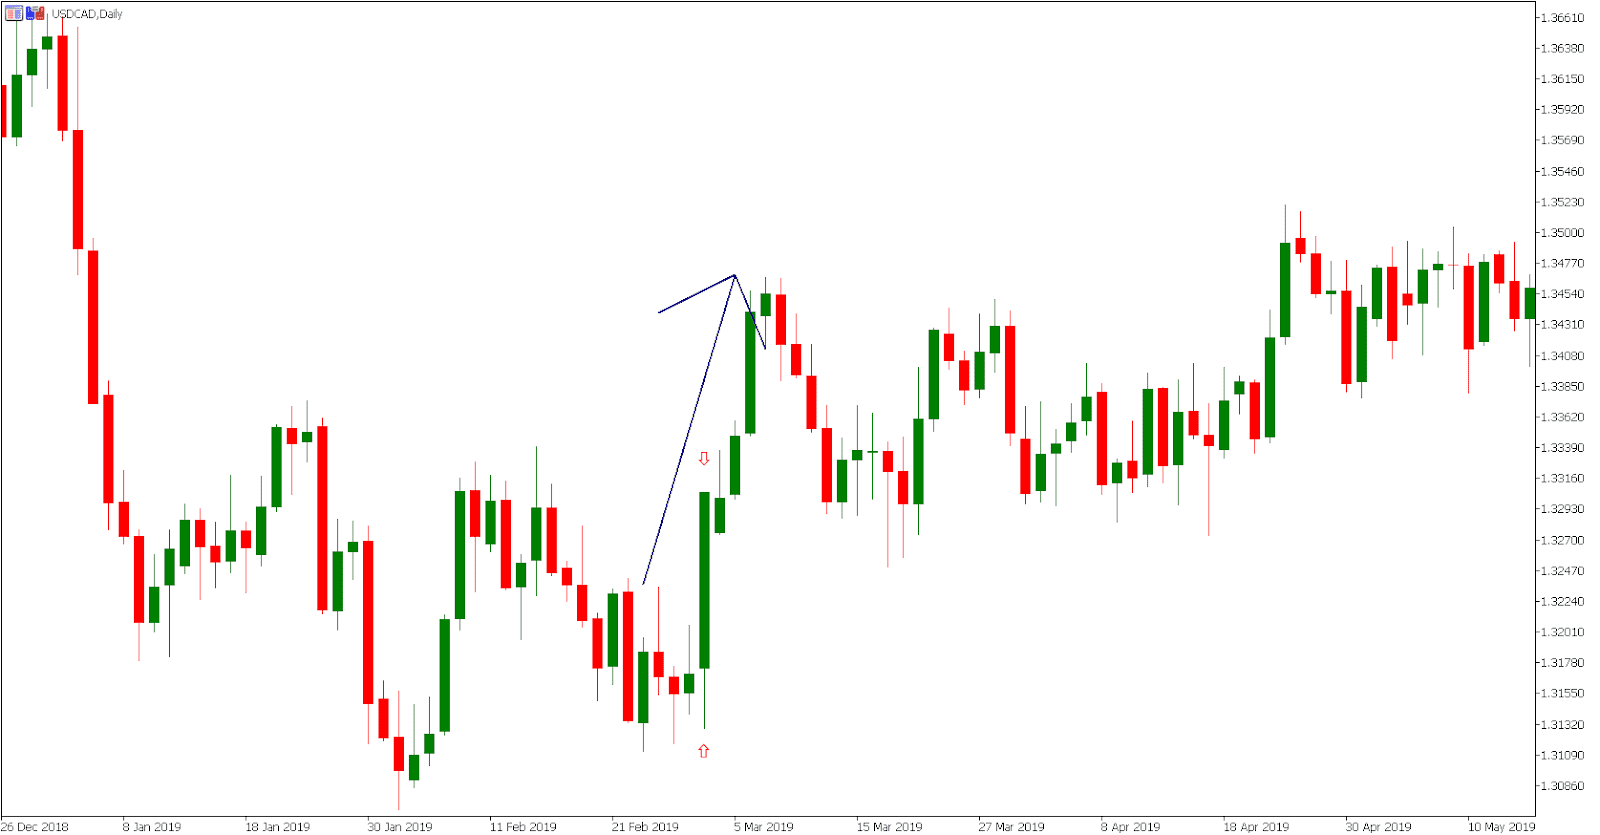
3. Candlestick Chart
Investors must identify trading patterns using candlesticks to enter a profitable trade. In this case, patterns are represented by combining two or more candles. A single candlestick can provide a better and more efficient market representation than multiple candles.
Taking advantage of these patterns, a trader can:
- Buy those more robust positions that can be indicated through the (bullish candle).
- Selling feeble positions that can be indicated through the red candlestick.
- Examine the preceding trend. If the current trend is bullish, the prior trend must be bearish, and vice versa.
Types of Candlestick Patterns
Single Candlestick
-
Marubozu
The word Marobuzo in Japanese means bald. So, in simple words, Marubozu is a candlestick with no upper or lower shadow, which means the security's price won't go above or below its opening and closing price.
-
Doji
Dojis occurs when shares' opening and closing prices are almost the same. Through this candlestick pattern, traders learn about the market sentiments.
-
Paper Umbrella

It's called a paper umbrella because of its structure, like an umbrella with a small natural body and a long lower wick. This pattern indicates which direction trades are taking place at a particular time. A pattern of this type changes its name in a downtrend or an uptrend.
So, when you see this pattern in a downtrend, it's called a hammer; when you see it in an uptrend, it's called a hanging man.
-
Shooting Star
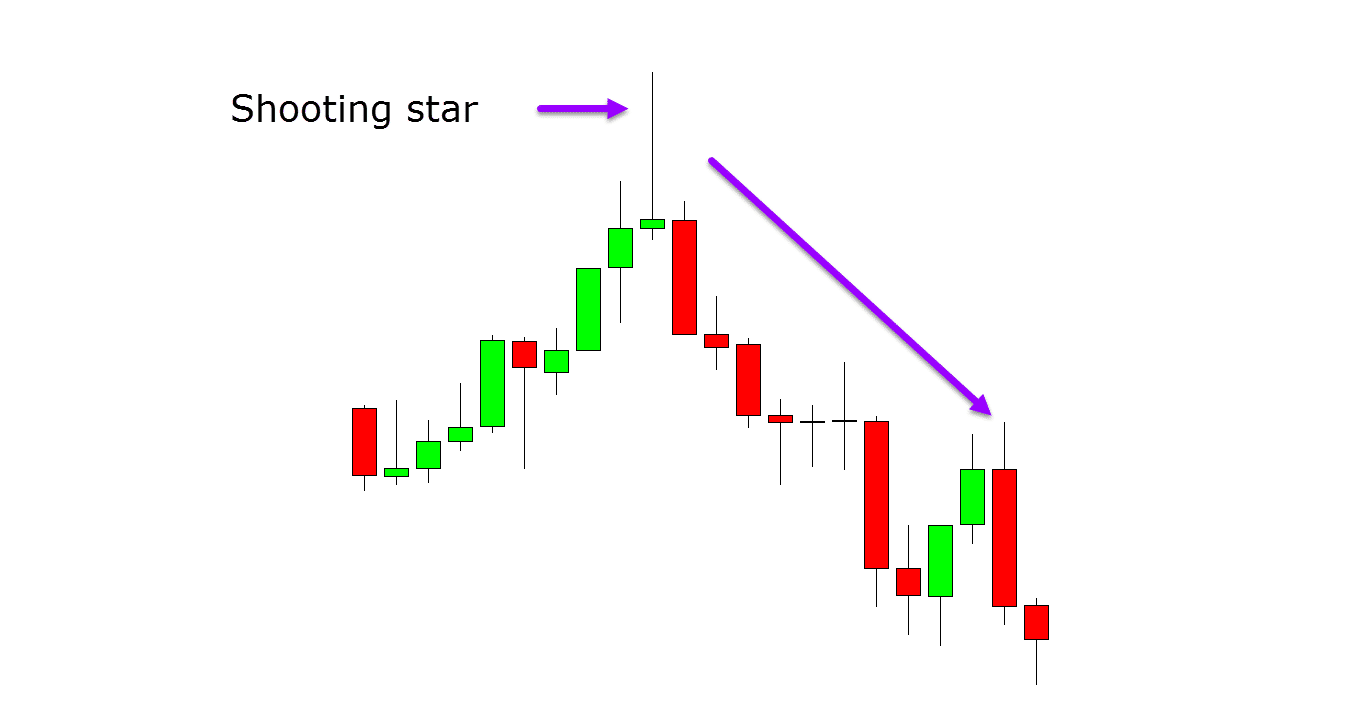
- You'd realise the shooting star exceptionally well if you understood the paper umbrella well.
- The shooting star is the inverted form of a paper umbrella and is bearish in the uptrend.
Multiple Candlestick
-
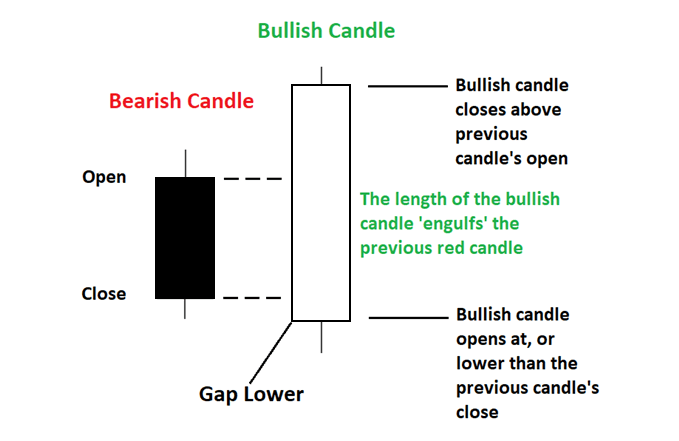
Engulfing patterns
If an investor wants to identify the trading opportunity, a single candlestick is enough, but if he wants to make an effective trading decision, multiple candlesticks are formed.
In engulfing, two candles form a pattern. The first candle is a small body. The second candle is a tall body that engulfs the first candle's body.
You can understand this with an image.
-
Piercing Pattern & The Dark Cloud Cover
This pattern is similar to bullish and bearish engulfing with a slight difference.
- The second day's blue candle partially engulfs the first day's lower candle (Red).
- The dark cloud cover observes the first day's blue candle being engulfed by the second day's red candle.
Technical Analysis Indicators
These are some indicators that traders or investors utilize to gauge market fluctuations and make better investment decisions.
1. Bollinger Bands
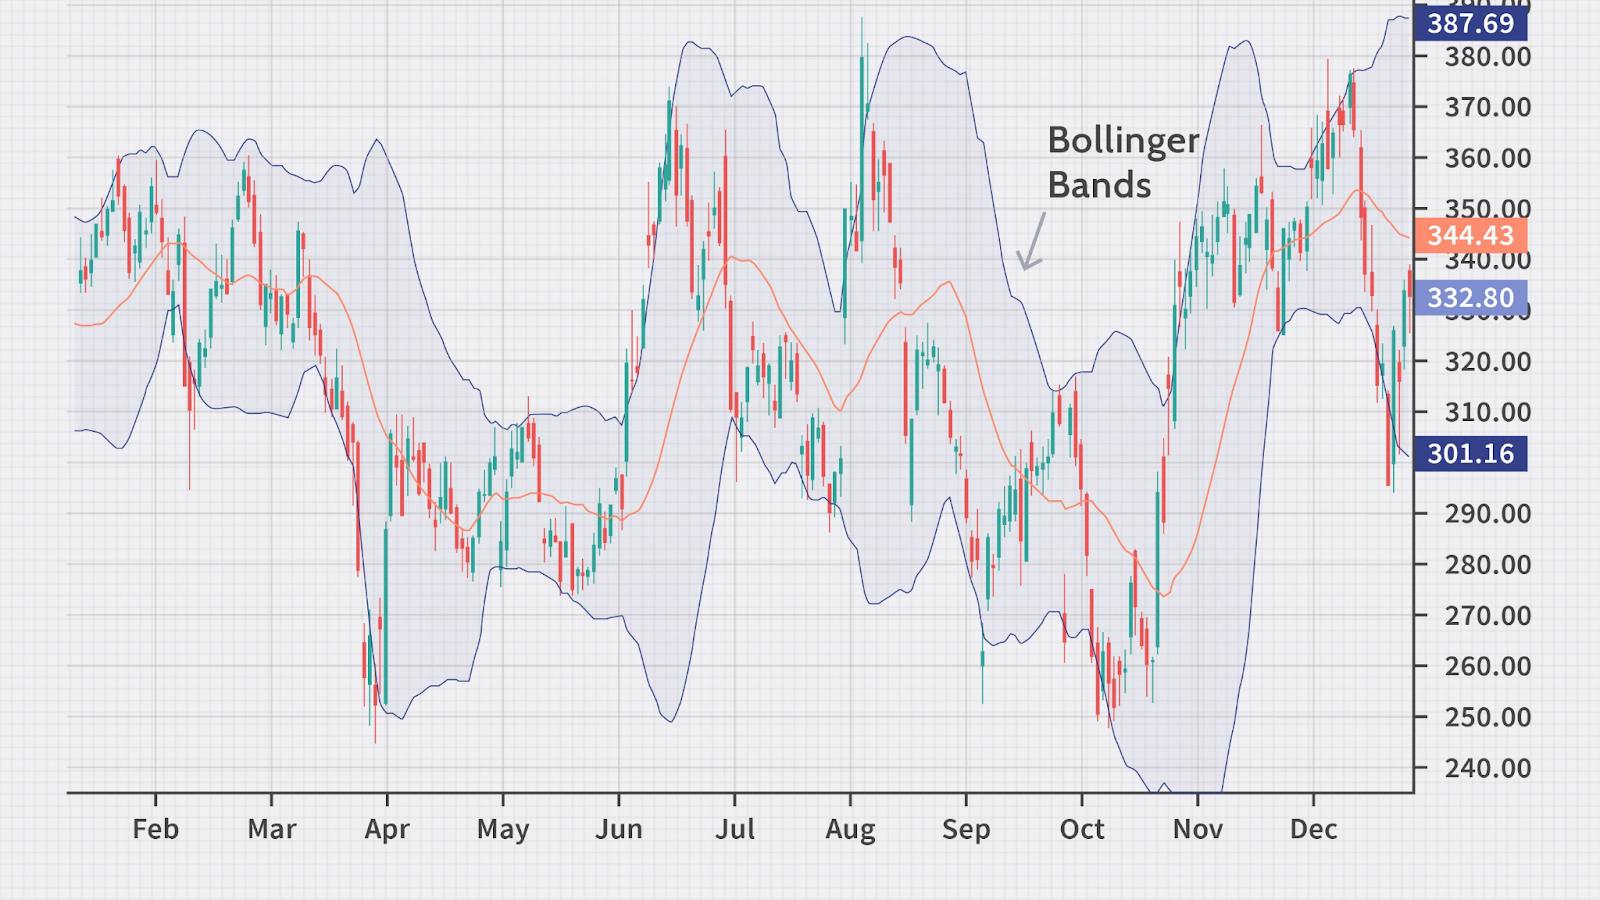
This indicator measures market volatility. The second band is the moving average of 20 days, and there are three bands, where the first and third are standard deviations of +2 and -2, respectively. The wider the bands, the greater the stock volatility, and vice versa.
2. Relative Strength Indicator (RSI)

This indicator measures the immensity of price fluctuation and indicates whether the price of the assets is overbought or oversold.
Let's say an asset's reading on a scale from 0 to 100 is 80. That asset's price will be overbought, whereas if another asset's reading is below 20, it is in the oversold zone.
3. Oscillators
Oscillators are tools that analysts use to determine whether stocks are overbought or oversold on a short-term basis. There is usually a range for oscillators (or a set of levels or lines).
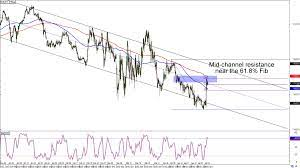
4. Support And Resistance
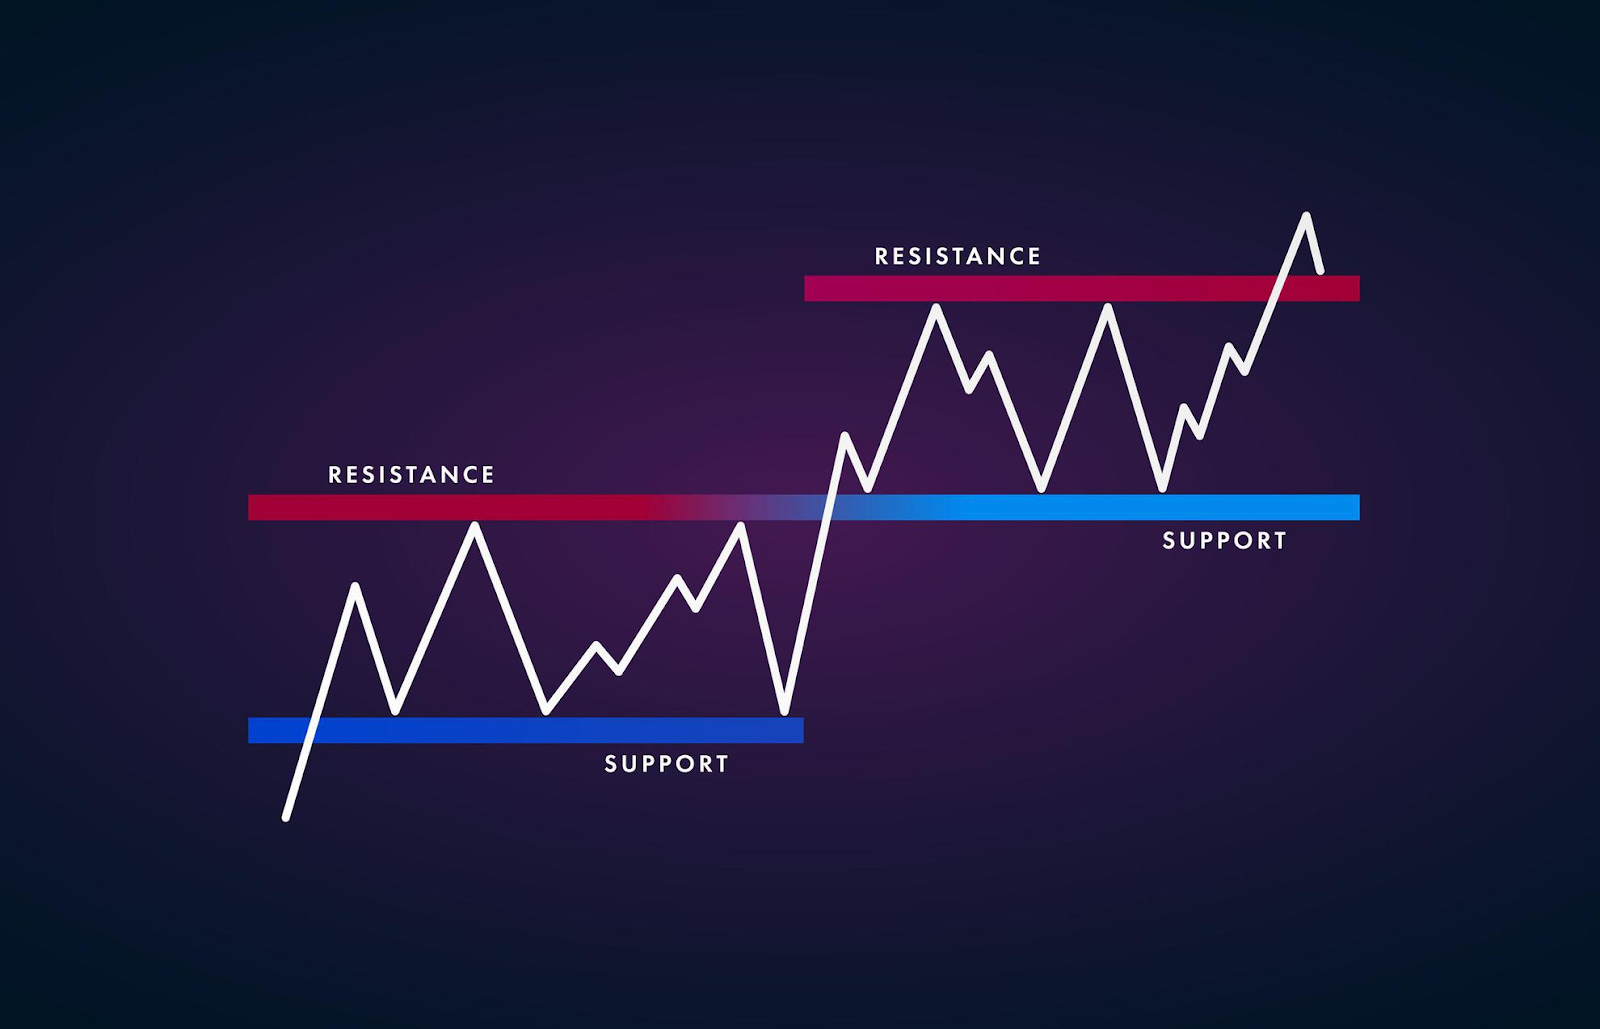
- On the chart, Support And Resistance refer to price points.
- Support indicates buying interest when a stock or share is priced below market value.
- Resistance indicates selling interest when a stock or share is priced above market value.
- Support And Resistance can be identified by drawing a horizontal line in a chart that connects at least three well-spaced price action zones.
- You can use Support And Resistance to identify targets and stop loss for your trade.
Why is it important to take a course in technical analysis at NIWS?
Technical analysis has limitations that can lead to havoc if not adequately addressed.
NIWS brings the most advanced Technical Analysis Courses to Delhi, Jaipur. The course empowers students with portfolio management skills. After completing the course, our students earn by intraday jobbing and investing in the stock market. While many have procured NIMS certificates and are placed at a good profile, the course has undoubtedly given a better entry and exit timing and boosted Risk management skills. Some of the limitations which need to be overruled by the professional courses include:
- Technical Analysis does not give any confirmation. This analysis is all about probability.
- Two technical analysts may have contradicting views regarding the same stock, giving a biased view.
- This analysis sometimes gives mixed signals as one indicator shows a buy signal, and the other shows a sell signal simultaneously.
- Investors or traders oscillate between two different approaches, leading them not to consistently follow their analysis, ultimately resulting in the loss of their money.
- It's easy to understand Technical Analysis basics, but implementing them in the real market is tricky.
- One significant drawback of technical analysis is that it does not account for the fundamentals, i.e., the company's earnings, how it is doing on its underlying surface, external events, and corporate reports.
- In technical analysis, investors or traders always rely on charts for their buying decisions, and because of this method, they don't even know why they are buying that company's share.
Conclusion
You can make huge profits through technical analysis in the stock market. What you require is guidance & knowledge about a technical analysis of the stock market so that you can make the best OG of technical analysis. The technical analysis institute in Delhi is waiting for you to provide all the proper knowledge required to make you the best technical analyst in the world.
NIWS is the predominant stock market institute in Jaipur. We offer a comprehensive list of Stock Market courses on the NSE, BSE, SEBI, NCFM, and NISM for intelligent investment, trading, data analysis, and research. Our centres are located in Delhi and Jaipur.
We also provide online courses that can be taken anywhere worldwide. Our courses are at a professional level, which could also help you get the best jobs in stock market broking firms as an investment advisor, technical analyst, or fundamental analyst.
By Umesh Sharma
MBA with 22 years of experience in Banking and Financial markets with expertise in marketing, administration, sales and training. He is working as Director, of marketing operations and wealth management in NIWS. He always innovates new ideas with a positive attitude and long-term vision, making him a key asset to the team NIWS. He is of firm belief that one can achieve goals by ethics, integrity and passion.