![]() 13 Jun 2024
13 Jun 2024
WD Gann Trading Techniques

 By Umesh Sharma
![]() Posted on 13 Jun 2024
Posted on 13 Jun 2024
In the dynamic world of financial markets, accurately predicting market trends can significantly enhance trading success. One of the most powerful tools for this purpose is the Elliott Wave Theory, which helps traders and analysts understand market psychology through identifiable wave patterns.
Additionally, W.D. Gann's theories, such as the Gann Angles and the Square of Nine, remain 90% accurate and are used to forecast market movements.
If you’re aiming to enter the stock market and book profits, learning Gann's theory is essential. NIWS, a top stock market institute in Delhi and Jaipur, offers expert courses on these theories to help you succeed.
Our expert traders at NIWS are ready to guide you through the Elliott Wave Theory pro course. Learn how this powerful theory can transform your trading strategies. Enroll now and take the first step towards becoming a proficient trader!
6 Most Used Gann's Trading Techniques and their Application
Traders have always used Gann's intra-day trading techniques. Here are the six most used trading techniques and their applications-
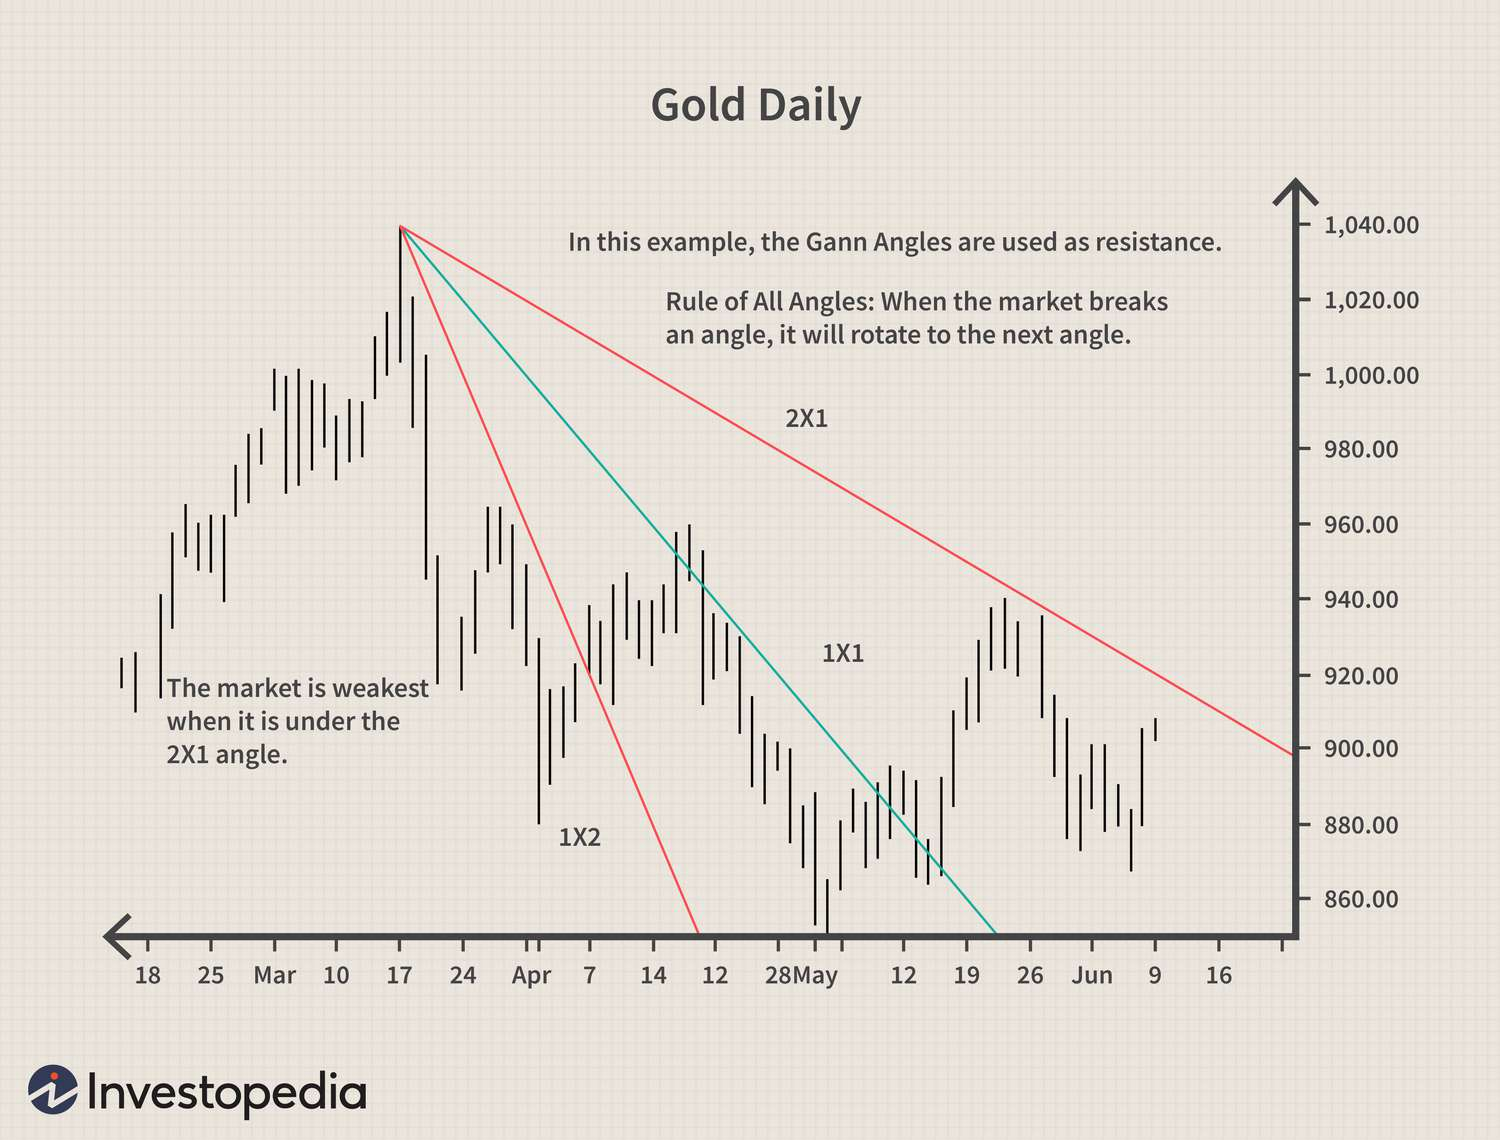
1. Gann Angles
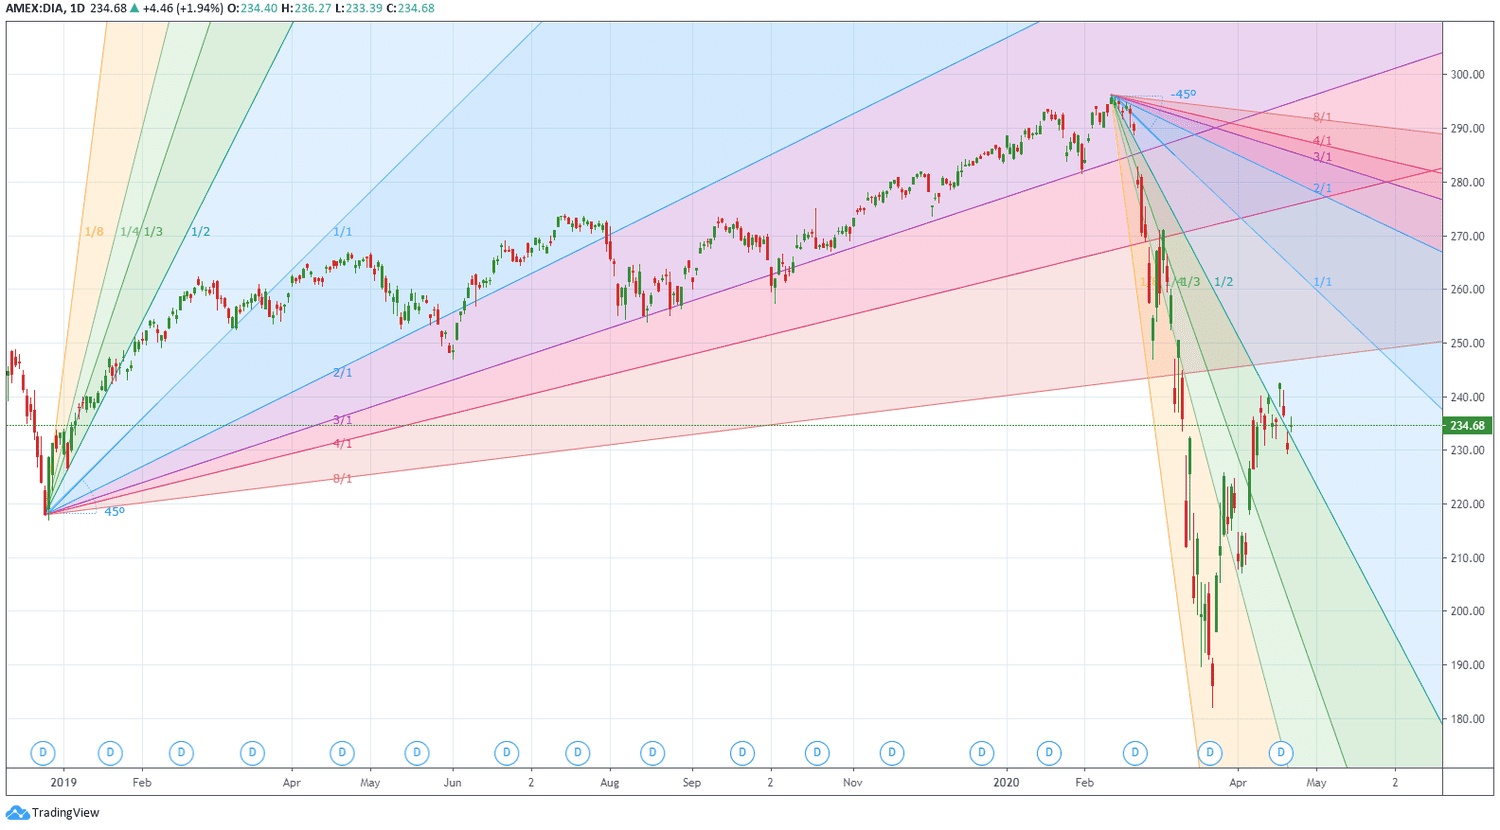
Gann believed that markets move in predictable angles. He used a series of angles to predict price movements, the most famous of which is the 1x1 angle, also known as the 45-degree angle.
Application:
-
1x1 Angle (45 Degrees): Represents one unit of price for one unit of time. When the price is above this angle, the market is strong; when below, it is weak.
-
Other Angles: 1x2, 2x1, 1x3, etc., representing different slopes.
Charting:
Draw angles from significant highs and lows to forecast potential support and resistance levels.
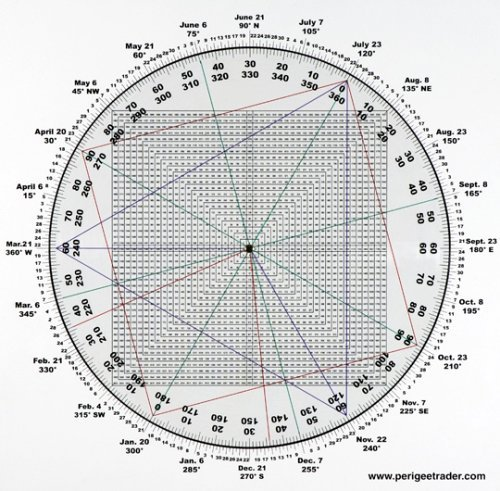
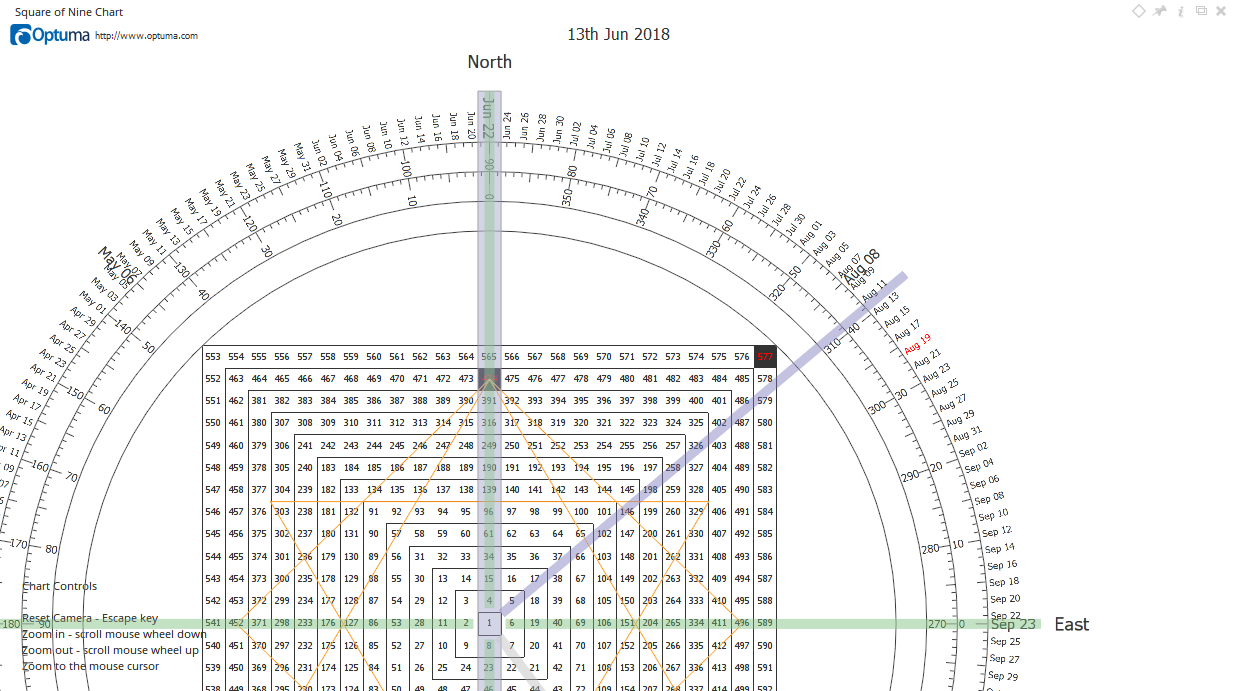
2. Gann Square of Nine
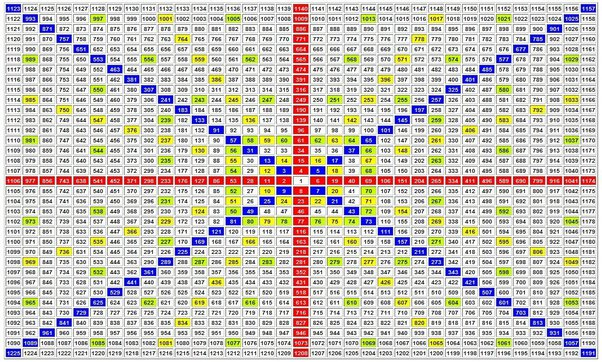
This is a spiral of numbers used to determine time and price relationships. Gann believed that the natural order of numbers profoundly impacted market movements.
Application:
-
Predicting Price Levels: By finding the price of a stock on the square and projecting future prices based on the square’s mathematical progression.
-
Time Cycles: Identifying significant dates when the market is likely to change direction
3. Gann Fans
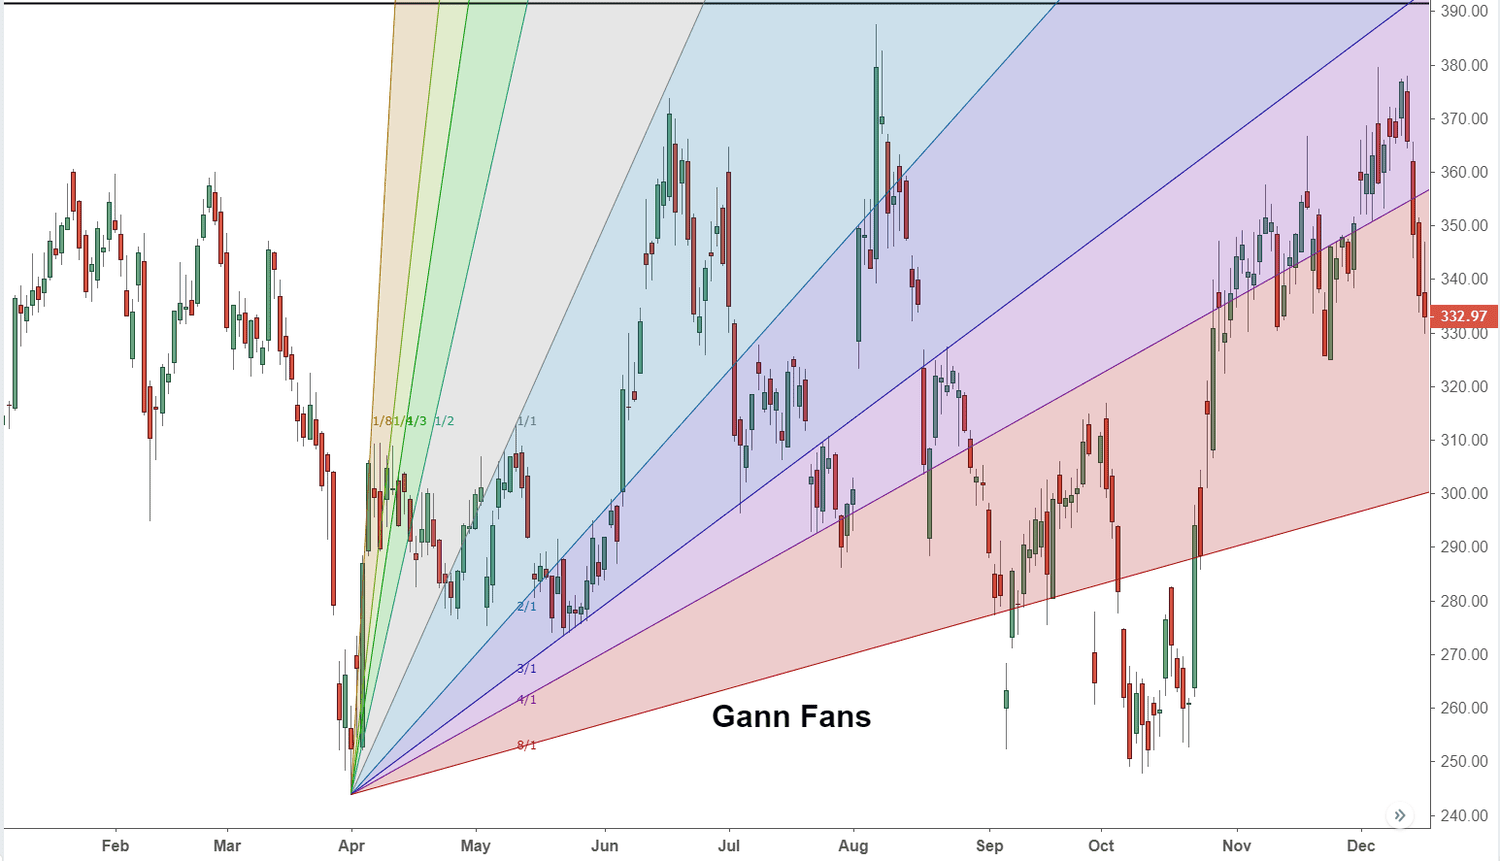
A Gann fan consists of several lines drawn from a central point, typically a high or low. These lines represent various angles and are used to predict support and resistance levels.
Application:
-
Drawing Fans: Begin at significant highs or lows and draw lines at angles like 1x1, 1x2, 2x1, 1x4, etc.
-
Interpreting Fans: Lines act as support/resistance levels. The price's interaction with these lines can indicate potential market turning points.
4. Gann Time Cycles
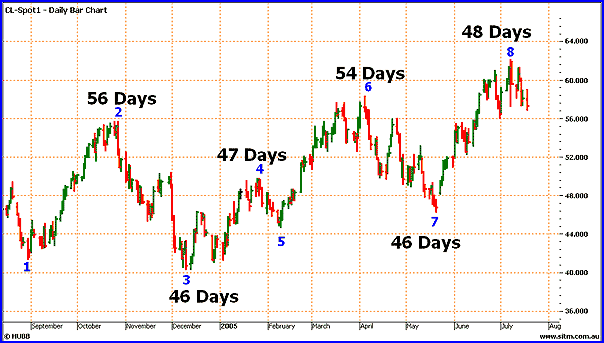
Gann emphasized the importance of time in trading, believing that market events occur in cyclical patterns.
Application:
-
Key Cycles: Gann identified several important cycles, such as 30, 60, 90 days, and yearly cycles like 5, 10, 20 years.
-
Forecasting: Analyzing historical price data to predict future market turning points based on these cycles.
5. Gann Swing Chart
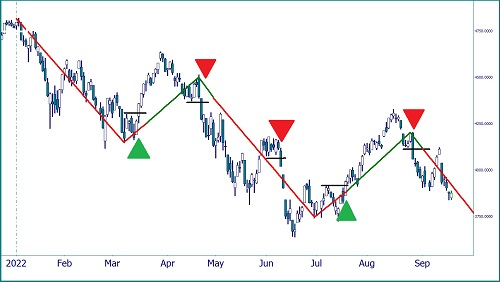
The Gann Swing Chart helps to identify market trends and reversals by focusing on the swing points in price movements.
Application:
-
Swing Points: Plot significant highs and lows to represent market swings visually.
-
Trend Identification: Determine the overall market trend and potential reversal points based on swing highs and lows.
6. Gann Retracements
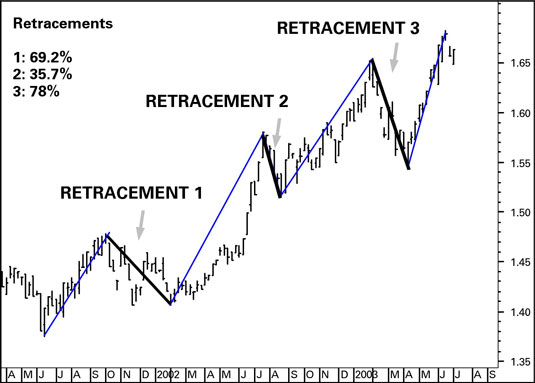
Gann Retracements help indicate potential reversal points,and resistance levels. The technique alone is not exact, and it is better to use it with other techniques for better results.
Application :
-
Monitor retracement levels to identify reversal points. This can help you minimize risk and get a better idea of when to enter and exit the market.
Other Less Common WD Gann Techniques
Let's discuss some of the lesser-known WD Gann Techniques-
Complex and Less Accessible
The techniques mentioned below are not easily accessible and are considered complex.
Gann Hexagon
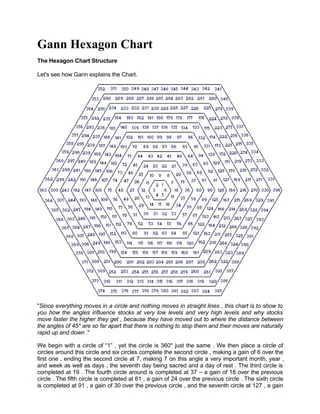
A hexagonal grid is used to forecast price movements and turning points.The angles and ratios are placed in a hexagonal shape on the price chart.
Application :
-
Traders must plot price data and time frames to identify potential support.
-
The complexity in constructing and interpreting the hexagonal grids makes it less common.
Gann Emblem
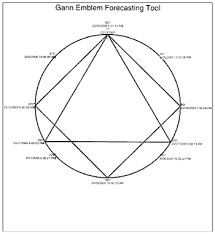
The star-shaped pattern is made to predict price movements and market cycles.
Application :
-
To apply this technique you have to find potential reversal zones.
-
This is less common because the complicated geometric design and the knowledge required to design it specifically are scarce.
Gann Mass Pressure Forecasting
This technique is used to identify the potential turning point of the market by analyzing market pressure based on volume, price and other factors.
Application :
-
To apply the technique, first evaluate the market and understand if it is bullish or bearish.
-
This technique is less common because it requires a deep understanding of the market to assess the sentiment.
Gann Degree Readings
Under this technique, correlating the price levels with specific degrees of the zodiac sign is done.
Application :
-
To apply this technique, traders must use the degree readings to predict price levels.
-
Since it has an astrological factor attached to it, most traders find this less credible, leading to less of its limited adoption.
Gann Wheel
Gann wheel is a circular chart used to find key price levels based on geometric angles. This helps traders understand the timing of market entry and exit.
Application :
-
To apply this, the wheel is used to project future support and resistance levels.
-
The construction and interpretation of the Gann Wheel require an understanding of geometry and can be seen as too complex for many traders.
Gann Time and Price Squaring
The technique requires balancing price and time for a specific period to determine market changes.
Application :
-
To apply this you have to analyze the relationship between price and its magnitude to forecast significant market reversals.
-
The technique's mathematical complexity and the need for precise calculations make it less user-friendly.
Gann Master Charts
Ganns Master Chart requires charts like Squares of Nine or Hexagons to visualize the market movement.
Application :
-
To apply the technique, identify the support and resistance levels with the key dates in the chart and make your move. However, the technique is less popular due to the difficulty in understanding these charts.
Gann Seasonal Trends
Ganns Seasonal Trends are based on the repeated patterns whose basis are on seasonal cycles, like weather patterns.
Application :
-
To apply this technique, you must first identify the seasonal pattern of time trades.
-
This technique is complex because it requires a lot of historical data, which may or may not align with the current market.
Gann Advanced Price and Time Squaring
This advanced technique requires analyzing time duration and price movement, which helps identify potential reversals.
Application :
-
To apply the technique, traders must find balanced points to predict significant market movements.
-
The advanced nature of the calculations proves to be a difficult task for traders who prefer more straightforward methods.
Gann Swing Charting Technique
The Swing Charting technique requires tracking market trends. This is done by identifying the market's highs and lows.
Application :
-
To apply the swing Charting technique, you must identify the primary and secondary trends with swing charts.
-
Because of the availability of modern technical analysis tools, this technique is seen as less sophisticated, making it less common.
Requires Specialized Knowledge
Let's discuss some of the techniques that require specialized knowledge to apply.
Gann Planetary Lines
Gann planetary lines require predicting market movements using the position of planets.
Application :
-
To apply this technique, traders must use plot lines based on planets to find the market's resistance and support levels.
-
It is less common because it requires knowledge of astrology, which is rare when we talk about basic financial trading.
Gann Dynamic Time Cycles
This technique involves analyzing time cycles that may vary in length and are usually not fixed.
Application :
-
To apply this technique, you must analyze and identify repeating time cycles and patterns to forecast market trends.
-
Due to the need for continuous time analysis, applying this technique is very complicated.
Specific Applications
Let's discuss some Techniques that require specific applications for it to work.
Gann Annual Forecast
The Annual Forecast technique predicts market behavior based on historical patterns and astrological cycles.
Application :
-
A trader can apply this technique only if they have studied past market behavior to forecast future trends.
-
This long-term forecasting technique is impractical for day-to-day traders and is often viewed skeptically.
Gann Market Geometry
This technique analyzes the market using geometric shapes and patterns. Traders use Gann angles and squares to predict market volatility and understand the resistance level.
Application :
-
To determine future financial market trends, you must identify patterns such as triangles, squares, and circles.
-
The application requires a strong understanding of geometry and its application to market movements; it is considered a barrier for traders.
Gann Elliott Wave Theory Integration
Elliott Wave Theory combines two technical analyses to predict market movement better.
Application :
-
To apply this technique, wave analysis is used to predict market trends more accurately. Combine the angles with time cycles to identify precise support.
-
Since the technique requires a deep understanding of Gann's and Elliott's theories, it is only suitable for advanced traders.
Gann Monthly Midpoint Method
In this technique, the month's trading range's midpoint is considered the month's average high and low price.
Application :
-
To apply this, use the midpoint as a potential support or resistance level. This technique is not recognized, as more straightforward methods exist to do the same thing.
Conclusion
Traders can benefit from Gann's theory because of its technical analysis capabilities. These techniques help you find out about the financial market's turning point and make a strategic decision regarding entering and exiting the market. These techniques are the hard proof that reminds us that the market is not merely based on trends but also on understanding the underlying principles that drive these markets.
Careful application of these techniques can help you execute profitable gains. Learn more about these techniques at NIWS, Jaipur, and Delhi's best stock market institute.
By Umesh Sharma
MBA with 22 years of experience in Banking and Financial markets with expertise in marketing, administration, sales and training. He is working as Director, of marketing operations and wealth management in NIWS. He always innovates new ideas with a positive attitude and long-term vision, making him a key asset to the team NIWS. He is of firm belief that one can achieve goals by ethics, integrity and passion.