![]() 17 Jun 2024
17 Jun 2024
Harmonic Trading Strategies: A Comprehensive Guide for Investors

 By Umesh Sharma
![]() Posted on 17 Jun 2024
Posted on 17 Jun 2024

Harmonic trading is an approach that uses price ratios and identifies harmonic patterns on the price chart. These patterns are identified to get a potential lead on reversal points, meaning a change in price direction of the assets in the market. What is harmonic trading? It is a method that, although altered over time, maintains its core principle: the market moves in predictable harmonic patterns.
These harmonic patterns are crucial as they help traders identify precise entry and exit points in trades. The main aim of harmonic trading is to predict future price movements based on historical data and previous market cycles.
If you are a trader or aspire to be a trader, with the help of professionals at NIWS, you can attain proper knowledge about these patterns or stock market insights. Industry experts at our stock market institute in Jaipur have deep knowledge and can offer career-oriented online and offline courses for investors and traders.
In this blog, our experts will explain you about harmonic trading and the various strategies to reap maximum profits.
Trading Strategies Using Harmonic Patterns
Some of the strategies using Harmonic Patterns include-
#Strategy 1 - Pattern Recognition
-
Traders can identify harmonic patterns in real-time by using software tools equipped with advanced pattern recognition algorithms.
-
Identifying the patterns can be done manually by scanning the price charts and applying the Fibonacci retracements to locate the potential pattern.
#Strategy 2 - Entry and Exit Points
-
Only after the completion of one harmonic pattern, traders enter the market. It is considered as the entry point.
-
Traders can place the stop loss to manage the risk if the price movement does not favor traders.
#Strategy 3 - Risk Management
-
Traders usually determine their position size based on their risk tolerance, this helps them manage the risk.
-
Sometimes traders tend to use trailing stops, so when price movements favor them, they can easily lock in their profits.
#Strategy 4 - Combining with Other Indicators
-
Using trend analysis, traders can confirm the overall trend's direction before entering the market.
-
Indicators like the Relative Strength Index (RSI) and Moving Average Convergence Divergence (MACD) can help traders understand the strength of the potential reversal points signaled by the harmonic patterns.
#Strategy 5 - Backtesting and Practice
Simple backtesting of past price data and analyzing historical data can help traders evaluate the performance of harmonic patterns under different market conditions.
Key Harmonic Patterns
Harmonic patterns use geometric price patterns and Fibonacci numbers to define precise turning points. Let's understand harmonic patterns.
#1 - Gartley Pattern
Gartley Pattern is one of the most commonly used harmonic patterns in technical analysis. This pattern looks like an M or a W when drawn on the price chart. This pattern helps traders understand trend reversals, which can help them make strategic entries and exits from the market.
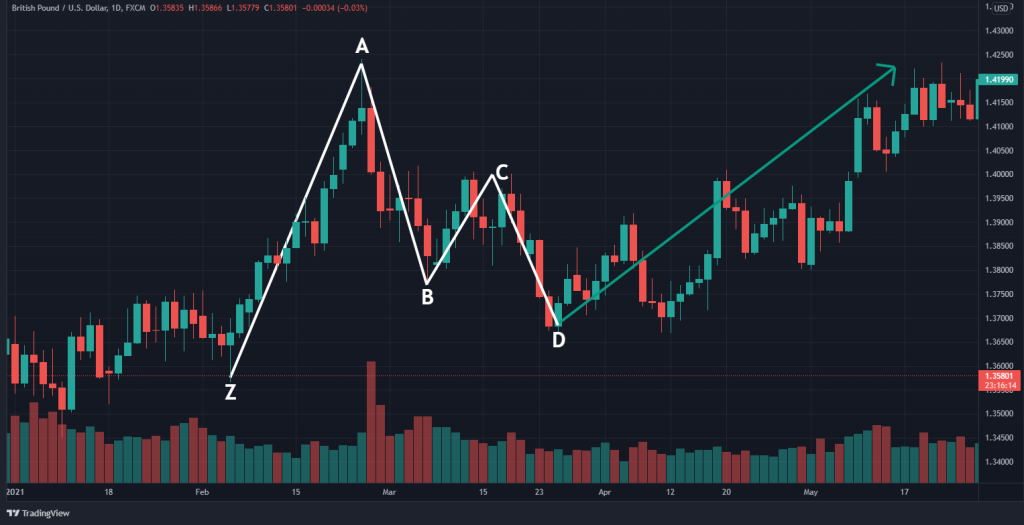
In the above pattern, the prices in the market are going up, which means it is a Bullish Gartley. The pattern consists of five elements—Z, A, B, C, and D which form the shape of the pattern, which is M.
-
In this, first- ZA presents price movement and it is rising.
-
Second move (AB)- There is a dip in the prices which can be retraced from point A to B.
-
Then, the price slightly goes up from point B to C. After that from point CD, you can easily see the dip in the market, and this is the completion of the trade pattern, and the potential point of reversal will start from point D.
Imagine a stock starts at ₹100 (X), rises to ₹150 (A), drops to ₹120 (B), rises to ₹140 (C), then falls to ₹110 (D). At point D, traders expect the price to reverse and go up again, following the Gartley pattern.
#2 - Bat Pattern
Scott Carney introduced the Bat Pattern in 2001. This pattern helps traders determine potential reversals in the financial market. This pattern often forms the bat-like structure on the price chart. It is well known for its accurate Fibonacci ratios, distinguishing it from patterns like Gartley and Butterfly.
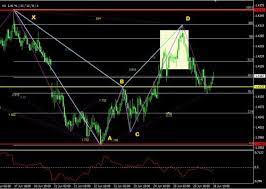
In the above diagram look for a significant high point where the pattern starts. In the image, it's marked with "X".
-
From point X, the price drops to a low point, marked as "A".
-
After hitting point A, the price moves up but doesn't reach the height of point X. This new high is point "B".
-
From point B, the price drops again to another low, lower than point A but not significantly lower. This is point "C".
-
Identify the final point (D): From point C, the price rises again, forming the final point "D". This point should be around the same level as point X.
The key to the Bat pattern is the specific short-term movement in the opposite direction before the price continues in the original direction and extension levels.
#3 - Butterfly Pattern
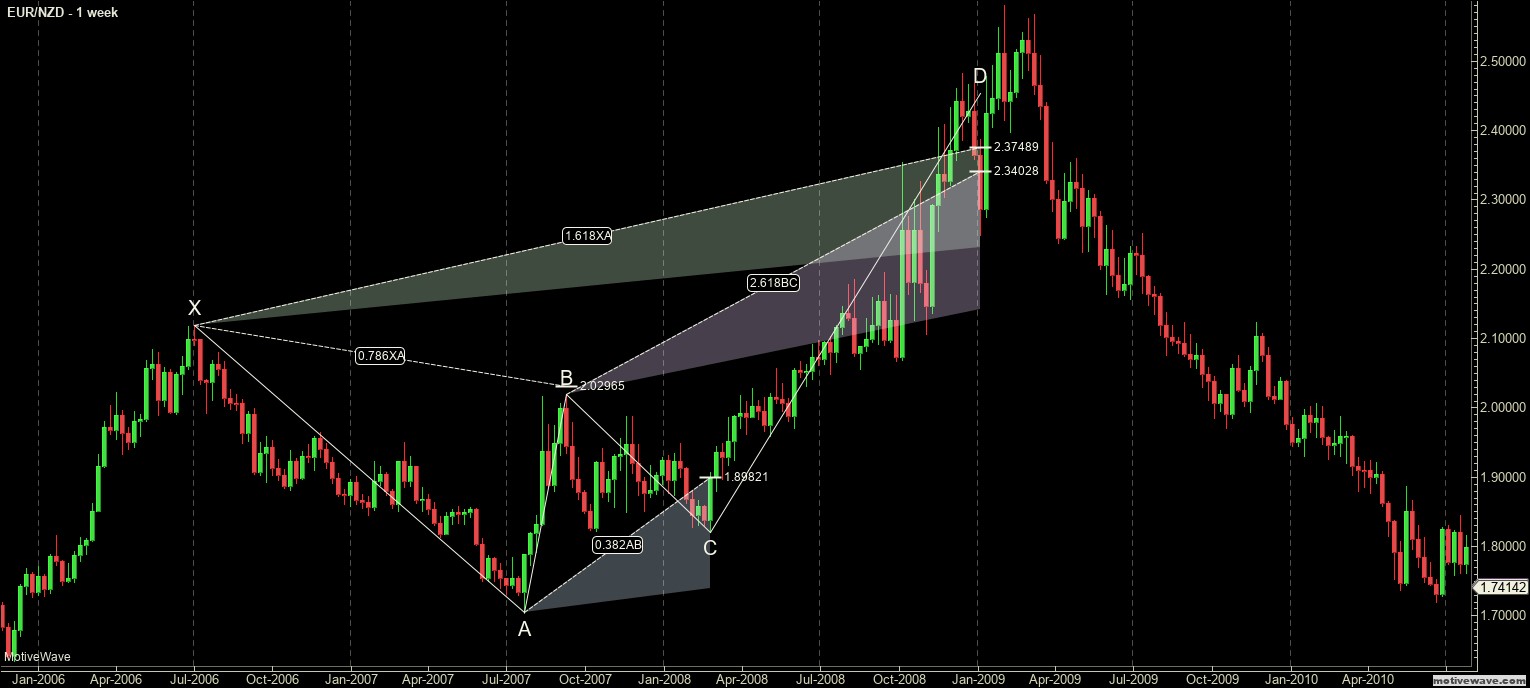
Bryce Gilmore discovered this pattern, which is a harmonic pattern very different from the Gartley pattern. The pattern itself resembles a stretched "M" or "W" shape on price charts, depending on whether it appears in a bullish or bearish setting. It helps traders make strategic decisions about their entry and exit in the market.
In the above diagram,
-
From point X, the price drops to a low point, marked as "A"
-
After hitting point A, the price moves up but doesn't reach the height of point X. This new high is point "B".
-
From point B, the price drops again to another low, lower than point A. This is point "C".
-
From point C, the price rises again, forming the final point "D". This point should be higher than point B and could be higher or lower than point X.
By understanding the specific movements between the points, you can identify the Butterfly pattern and use it in trading strategies.
#4 - Crab Pattern
The Crab Pattern is helpful for traders who want to gain through sharp price movements. Scott Carney discovered it in 2000. It is famous for its extreme Fibonacci level.
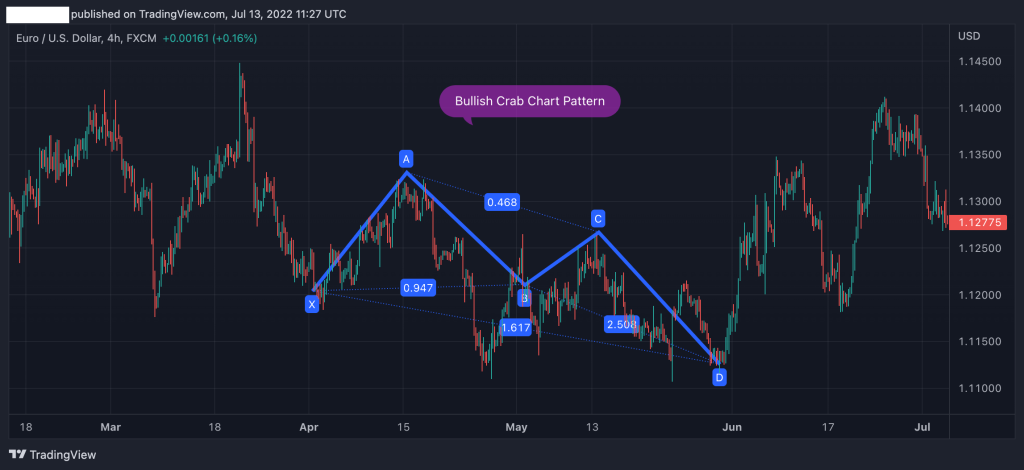
It consists of five key points: X, A, B, C, and D. Look for the starting low point in the price chart, marked as "X" in the image.
-
Move to the next point (A): From point X, the price rises to a significant high point, marked as "A".
-
Find the retracement to point (B): After hitting point A, the price drops down to point B.
-
Draw to the next point (C): From point B, the price moves up again to point C.
-
Identify the final point (D): From point C, the price moves down to point D.
#5 - Shark Pattern
This was introduced in harmonic patterns recently by Scott Carney. It is a five-leg reversal pattern. A shark pattern looks like a fish like pattern on the price chart.
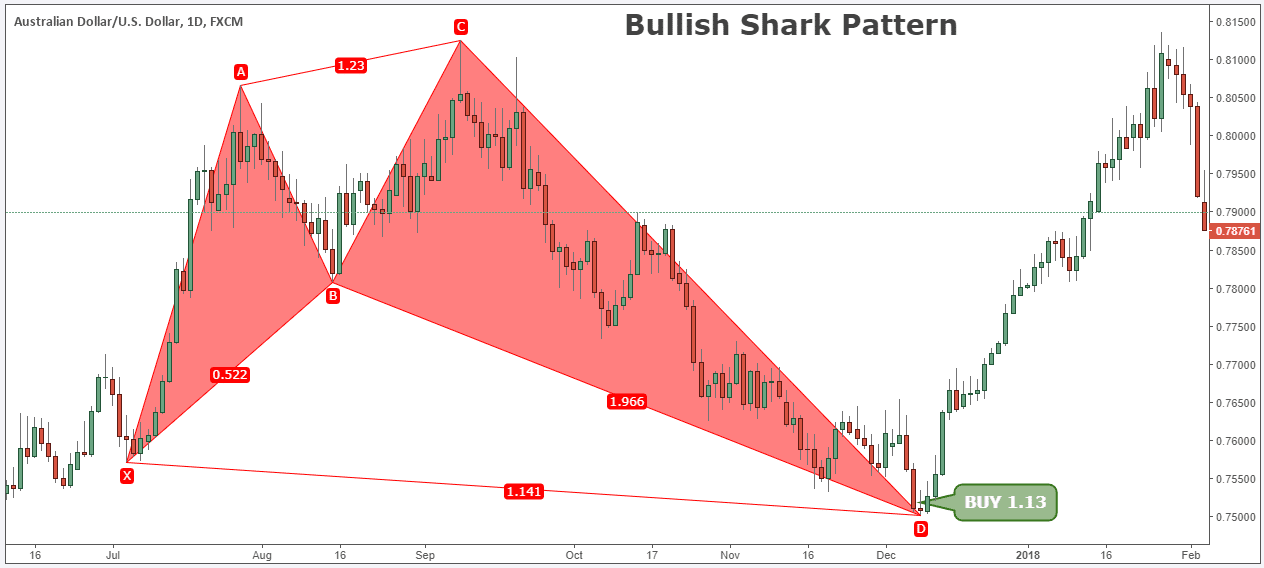
The above price chart shows a shark pattern. Let’s break it down step by step.
-
Initial Move (XA) - The price starts to go up from point A to point X. In the image, this is represented by the vertical line on the left side of the chart.
-
Retracement (AB) - The price goes back down from point X to point B, but not all the way down to point A.
-
Second Move (BC) - The price goes up again from point B to point C, but higher than the initial move from A to X.
-
Potential Reversal (CD) - The price goes down from point C to point D. This is where traders expect the price to reverse and start going up again.
Advantages of Harmonic Trading
-
Harmonic patterns like The Butterfly and Gartley are well known for their high accuracy in predicting potential reversal points in market conditions. These patterns are based on Fibonacci numbers, giving traders a clear signal to enter or exit the market.
-
By following the rules for pattern recognition, traders can make an objective and utterly rational decision while trading.
-
With harmonic patterns, there is a potential for a higher reward-to-risk ratio.
Challenges of Harmonic Trading
-
Harmonic trading depends on precise Fibonacci ratios and extension ratios for pattern identification. So, in this case, any deviation by traders can lead to false signals or poor identification of reversal points.
-
Harmonic patterns like Gartley and Butterfly are challenging to draw on the price chart. Traders need to recognize geometric shapes with a keen eye.
-
Harmonic patterns require extensive practice and pattern recognition skills from traders.
Conclusion
Traders use harmonic trading patterns to predict future market movements. Continuously practicing and refining their harmonic trading skills can help them identify harmonic patterns efficiently.
It is an exact and mathematical way of predicting the reversal points in the market. There are challenges like dependence on Fibonacci ratios, difficulty indrawing the patterns on price charts, and extensive practice to recognize the patterns, which make it difficult for regular traders to apply the strategies.
However, with proper discipline and keen interest in these patterns, traders can learn the potential entry and exit time from the market and gain potential benefits from harmonic trading in the financial market.
Are you looking forward to learn more about Harmonic trading and other strategies used in stock market? If yes, then our professional traders and stock market experts at NIWS will assist you to the best. Connect with the stock market experts at NIWS now to know more!
By Umesh Sharma
MBA with 22 years of experience in Banking and Financial markets with expertise in marketing, administration, sales and training. He is working as Director, of marketing operations and wealth management in NIWS. He always innovates new ideas with a positive attitude and long-term vision, making him a key asset to the team NIWS. He is of firm belief that one can achieve goals by ethics, integrity and passion.