![]() 15 Jan 2025
15 Jan 2025
Cup and Handle Pattern

 By Umesh Sharma
![]() Posted on 15 Jan 2025
Posted on 15 Jan 2025
The Cup and Handle Pattern is a popular chart pattern in technical analysis. It helps traders spot potential bullish trends in stocks, commodities, or cryptocurrencies. This pattern is named after its shape, which resembles a teacup with a handle.
Traders value this pattern because it often signals that a price breakout is coming. By learning how to recognise it, you can better time your trades and improve your chances of success.
In this blog, we’ll dive into what the Cup and Handle Pattern is, how it works, and how you can use it effectively in your trading.
What is the Cup and Handle Pattern?
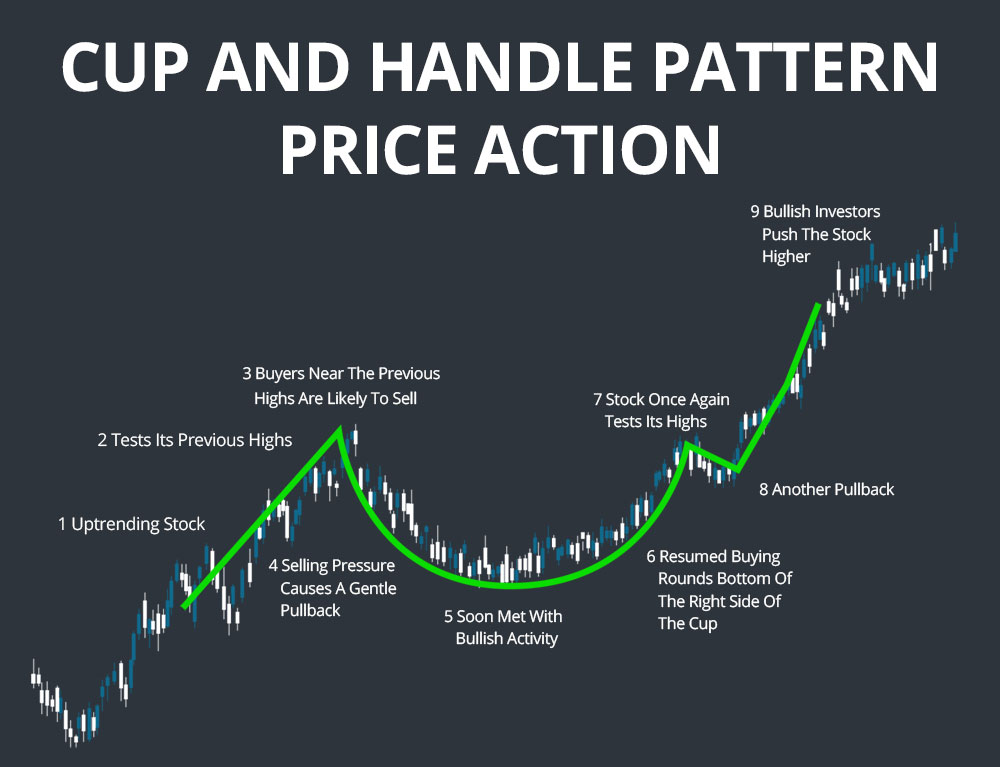
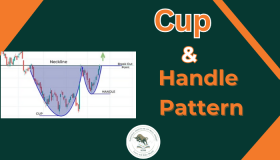
The Cup and Handle Pattern is a bullish chart pattern that signals a possible upward price breakout. It is named for its distinct shape: the cup looks like a rounded "U," while the handle forms a small downward consolidation or pullback.
This pattern typically forms during a market uptrend and indicates a continuation of that trend. The cup represents a phase where the price stabilises after a decline, while the handle shows a brief pause before the price moves higher. Once the price breaks above the resistance level (the top of the cup), traders expect the asset to rise further.
This pattern is widely used by traders and investors because it’s easy to recognise and offers reliable trading opportunities when confirmed by a breakout.
Key Features of the Cup and Handle Pattern
To effectively use the Cup and Handle Pattern, it’s important to understand its key features. Here's what defines this pattern:
1. The Cup
-
Shape: The cup has a rounded bottom, resembling the letter "U."
-
Depth: A shallow cup is more reliable than a deep one.
-
Trend: It forms after a period of price decline and stabilisation.
2. The Handle
-
Formation: The handle appears as a small pullback or consolidation after the cup.
-
Angle: It usually slopes slightly downward but shouldn’t be too deep.
-
Timeframe: The handle forms quickly compared to the cup.
3. The Breakout
-
Resistance Level: The top of the cup creates a horizontal resistance line.
-
Price Movement: The breakout occurs when the price moves above this resistance.
-
Volume: Breakouts are typically accompanied by high trading volume, confirming the pattern.
This combination of features makes the Cup and Handle Pattern a reliable indicator of bullish momentum. By recognising these components, traders can identify the pattern and prepare for a potential price surge.
How to Identify a Cup and Handle Pattern
Spotting a Cup and Handle Pattern on a price chart is straightforward if you know what to look for. Here are the steps to identify it:
1. Look for the Cup
-
The price should form a smooth, rounded bottom.
-
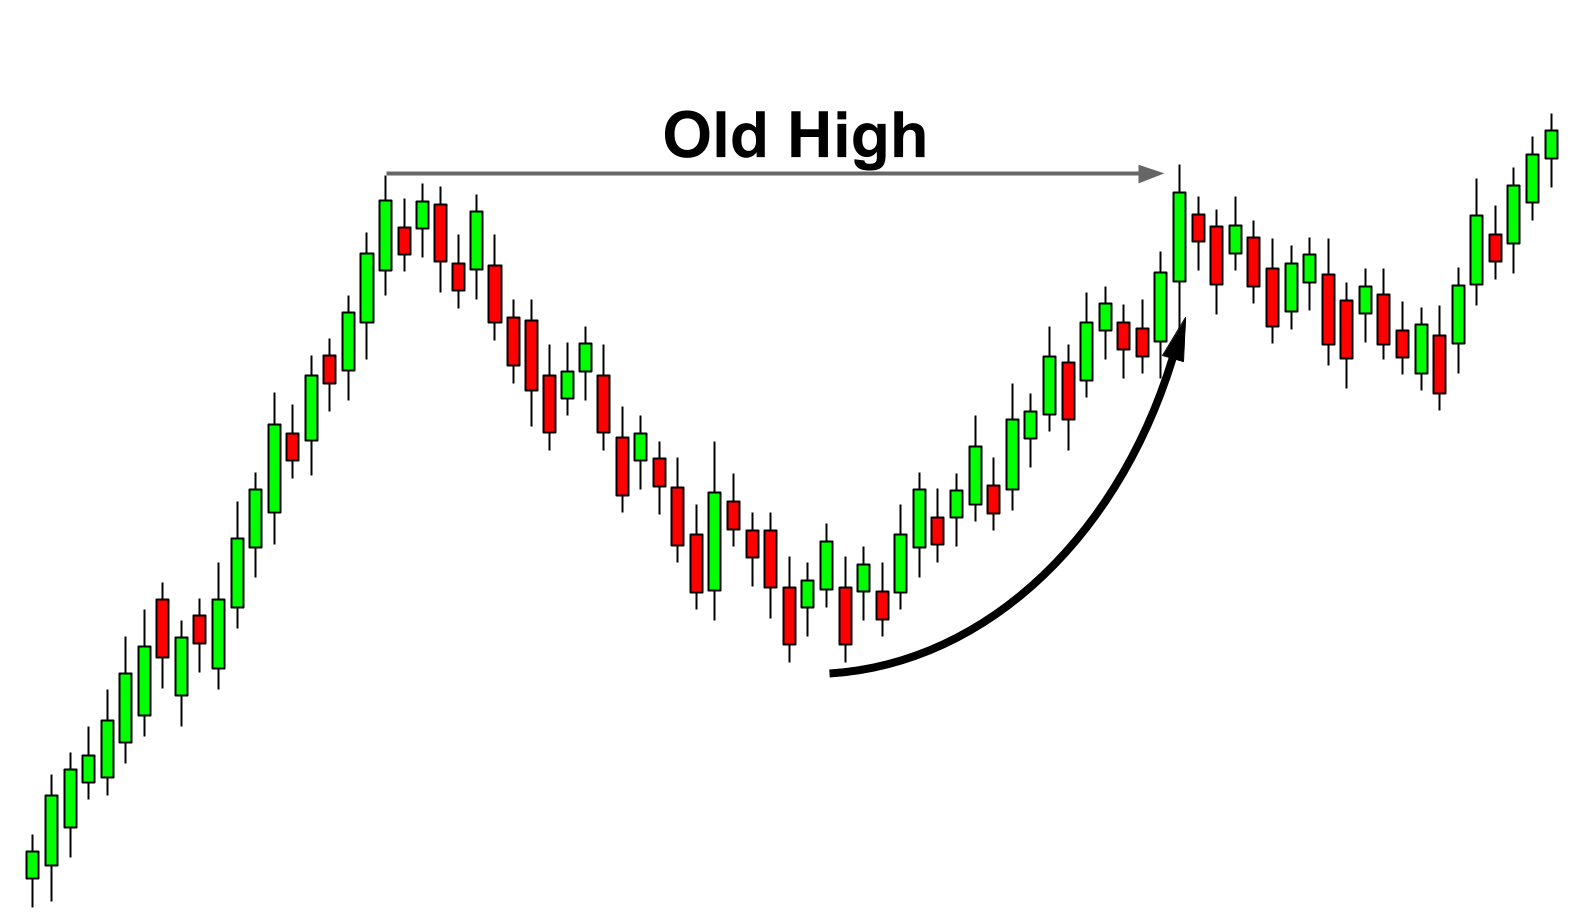
The edges of the cup (the rim) should be at roughly the same price level.
-
Avoid cups with sharp or V-shaped bottoms, as they’re less reliable.
2. Check for the Handle
-
After the cup forms, the price will typically pull back slightly to create a handle.
-
The handle should not fall too deep — generally no more than 10-15% of the cup’s height.
-
The handle often looks like a small flag or wedge pattern.
3. Identify the Resistance Line
-
Draw a horizontal line connecting the cup’s rims.
-
This line acts as the resistance level that the price must break to confirm the pattern.
4. Confirm with Volume
-
Look for low trading volume during the cup and handle formation.
-
A spike in volume during the breakout signals a valid pattern.
By following these steps, you can confidently spot the Cup and Handle Pattern and prepare to trade the breakout.
Trading the Cup and Handle Pattern
Once you’ve identified a Cup and Handle Pattern, the next step is to trade it effectively. Here’s how to do it:
1. Entry Strategy
-
Enter the trade when the price breaks above the resistance line (the top of the cup).
-
Look for a strong breakout accompanied by high trading volume.
-
Avoid entering before the breakout, as the price may reverse.
2. Setting a Stop Loss
-
Place your stop loss just below the handle’s low point.
-
This helps protect your capital in case the breakout fails.
3. Calculating the Target Price
-
Measure the depth of the cup (distance between the bottom of the cup and the resistance line).
-
Add this depth to the resistance level to calculate your target price.
-
Example: If the cup depth is ₹50 and the breakout occurs at ₹500, the target price is ₹550.
-
4. Monitor Volume and Momentum
-
A successful breakout should have strong volume and bullish momentum.
-
If volume is low during the breakout, it could indicate a false breakout.
By following these steps, you can maximise the chances of a successful trade using the Cup and Handle Pattern.
Real-Life Examples of the Cup and Handle Pattern
To better understand the Cup and Handle Pattern, let’s look at some examples from real trading scenarios.
1. Stock Market Example
-
Stock: ABC Corporation
-
Pattern: Over three months, the stock price formed a rounded bottom, reaching ₹200 at the cup’s low. The price then rose to ₹300, forming the cup’s rim.
-
Handle: After the cup, a slight pullback brought the price down to ₹280, forming the handle.
-
Breakout: The price broke above ₹300 with strong volume, confirming the pattern.
-
Result: The stock surged to ₹350, matching the target calculated from the cup’s depth.
2. Cryptocurrency Example
-
Asset: Bitcoin
-
Pattern: Over six weeks, Bitcoin’s price formed a cup between $40,000 and $50,000, with a rounded base at $42,000.
-
Handle: A short consolidation dropped the price to $48,000.
-
Breakout: The price broke past $50,000, accompanied by a spike in trading volume.
-
Result: Bitcoin rallied to $58,000, achieving the expected price target.
3. Commodities Example
-
Commodity: Gold
-
Pattern: Gold prices formed a cup between $1,800 and $2,000 over four months.
-
Handle: A pullback to $1,950 created the handle.
-
Breakout: Gold broke out at $2,000, with significant volume increase.
-
Result: Prices climbed to $2,200 in the following weeks.
These examples show how the Cup and Handle Pattern works across various markets. Practising with real charts can help you master identifying and trading this pattern.
Advantages of the Cup and Handle Pattern
The Cup and Handle Pattern is a favourite among traders because it provides clear signals and is versatile. Here are its main advantages:
1. Easy to Recognise
-
The pattern’s distinctive shape makes it simple to spot on price charts.
-
It’s ideal for both beginner and experienced traders.
2. Reliable for Bullish Trends
-
It often signals the continuation of an uptrend, providing confidence to traders.
-
When confirmed with volume, it’s a strong indicator of future price gains.
3. Applicable to Various Markets
-
Works well across stocks, commodities, and cryptocurrencies.
-
Suitable for different timeframes, from intraday to long-term charts.
4. Clear Entry and Exit Points
-
The breakout above the resistance line offers a clear entry signal.
-
The cup’s depth helps calculate realistic price targets.
5. Combines Well with Other Tools
-
Can be used alongside other indicators like volume, RSI, and MACD to strengthen predictions.
The Cup and Handle Pattern’s simplicity and effectiveness make it a powerful tool in a trader’s arsenal.
Limitations and Risks of the Cup and Handle Pattern
While the Cup and Handle Pattern is a powerful tool, it has its limitations. Understanding these risks can help you use it more effectively.
1. False Breakouts
-
Not all breakouts lead to higher prices.
-
Low volume during the breakout can indicate a lack of buyer interest, causing the price to reverse.
2. Difficult to Spot
-
The pattern can be tricky to identify on volatile charts.
-
Irregular or sharp bottoms may resemble a cup but lack reliability.
3. Time-Consuming Formation
-
The cup can take weeks or months to form, testing a trader’s patience.
-
Impatience may lead to premature trades before the breakout.
4. Handle Depth
-
A handle that dips too low invalidates the pattern.
-
Traders must carefully analyse the handle’s size relative to the cup.
5. Dependence on Other Indicators
-
The pattern should not be used in isolation.
-
Volume and momentum indicators are crucial for confirming the breakout.
By being aware of these limitations, traders can avoid common pitfalls and use the Cup and Handle Pattern more effectively.
Tips for Trading the Cup and Handle Pattern Successfully
To maximise your success with the Cup and Handle Pattern, follow these practical tips:
1. Be Patient
-
Allow the pattern to fully form before making a move.
-
Premature entries during the cup or handle formation can lead to losses.
2. Confirm the Breakout
-
Wait for the price to break above the resistance level.
-
Ensure the breakout is accompanied by high trading volume for validity.
3. Use Stop Loss Orders
-
Place a stop loss just below the handle’s low to limit potential losses.
-
Adjust your stop loss as the price rises to protect your profits.
4. Combine with Other Indicators
-
Use tools like RSI (Relative Strength Index) to check if the asset is overbought or oversold.
-
Monitor MACD (Moving Average Convergence Divergence) to confirm momentum.
5. Focus on Reliable Patterns
-
Look for well-formed cups with smooth, rounded bottoms and shallow handles.
-
Avoid patterns with sharp V-shaped bottoms or deep handles.
6. Set Realistic Targets
-
Use the cup’s depth to calculate your price target.
-
Avoid chasing unrealistic gains; stick to the strategy.
By applying these tips, you can trade the Cup and Handle Pattern more confidently and effectively.
Conclusion
The Cup and Handle Pattern is a valuable tool for traders looking to spot bullish opportunities in the market. Its simple structure and clear breakout signals make it a go-to pattern for identifying potential price surges. By understanding the cup’s rounded bottom, the handle’s brief pullback, and the importance of volume during a breakout, you can use this pattern to make smarter trading decisions.
However, success with this pattern requires patience, practice, and careful analysis. Always combine it with other indicators and strategies to confirm its validity. Whether you’re trading stocks, commodities, or cryptocurrencies, the Cup and Handle Pattern can help you stay ahead of the curve and improve your trading outcomes.
Start practising today by analysing historical charts and applying the insights you’ve gained. With time and experience, this pattern can become a reliable part of your trading toolkit.
Ready to Master Trading?
Learn advanced trading strategies and technical analysis, including patterns like the Cup and Handle, from industry experts at NIWS Stock Market Institute in Jaipur. Join our comprehensive courses to build a strong foundation in stock market trading and investment.
By Umesh Sharma
MBA with 22 years of experience in Banking and Financial markets with expertise in marketing, administration, sales and training. He is working as Director, of marketing operations and wealth management in NIWS. He always innovates new ideas with a positive attitude and long-term vision, making him a key asset to the team NIWS. He is of firm belief that one can achieve goals by ethics, integrity and passion.